Dashboard
The J2Commerce Dashboard is the first screen you see after opening J2Commerce in the Joomla administrator. It provides a real-time snapshot of your store's performance -- revenue, orders, conversion rate, active sessions, sales trends, and recent activity -- all on a single page. You can filter the key metrics by date range and watch the numbers and charts update instantly without a page reload.
The dashboard is also the home for the Store Setup Wizard, an onboarding checklist that walks you through every step needed to launch your store.
Requirements
- with PHP 8.3.0 +
- Joomla! 6.x
- J2Commerce 6.x
How to Access the Dashboard
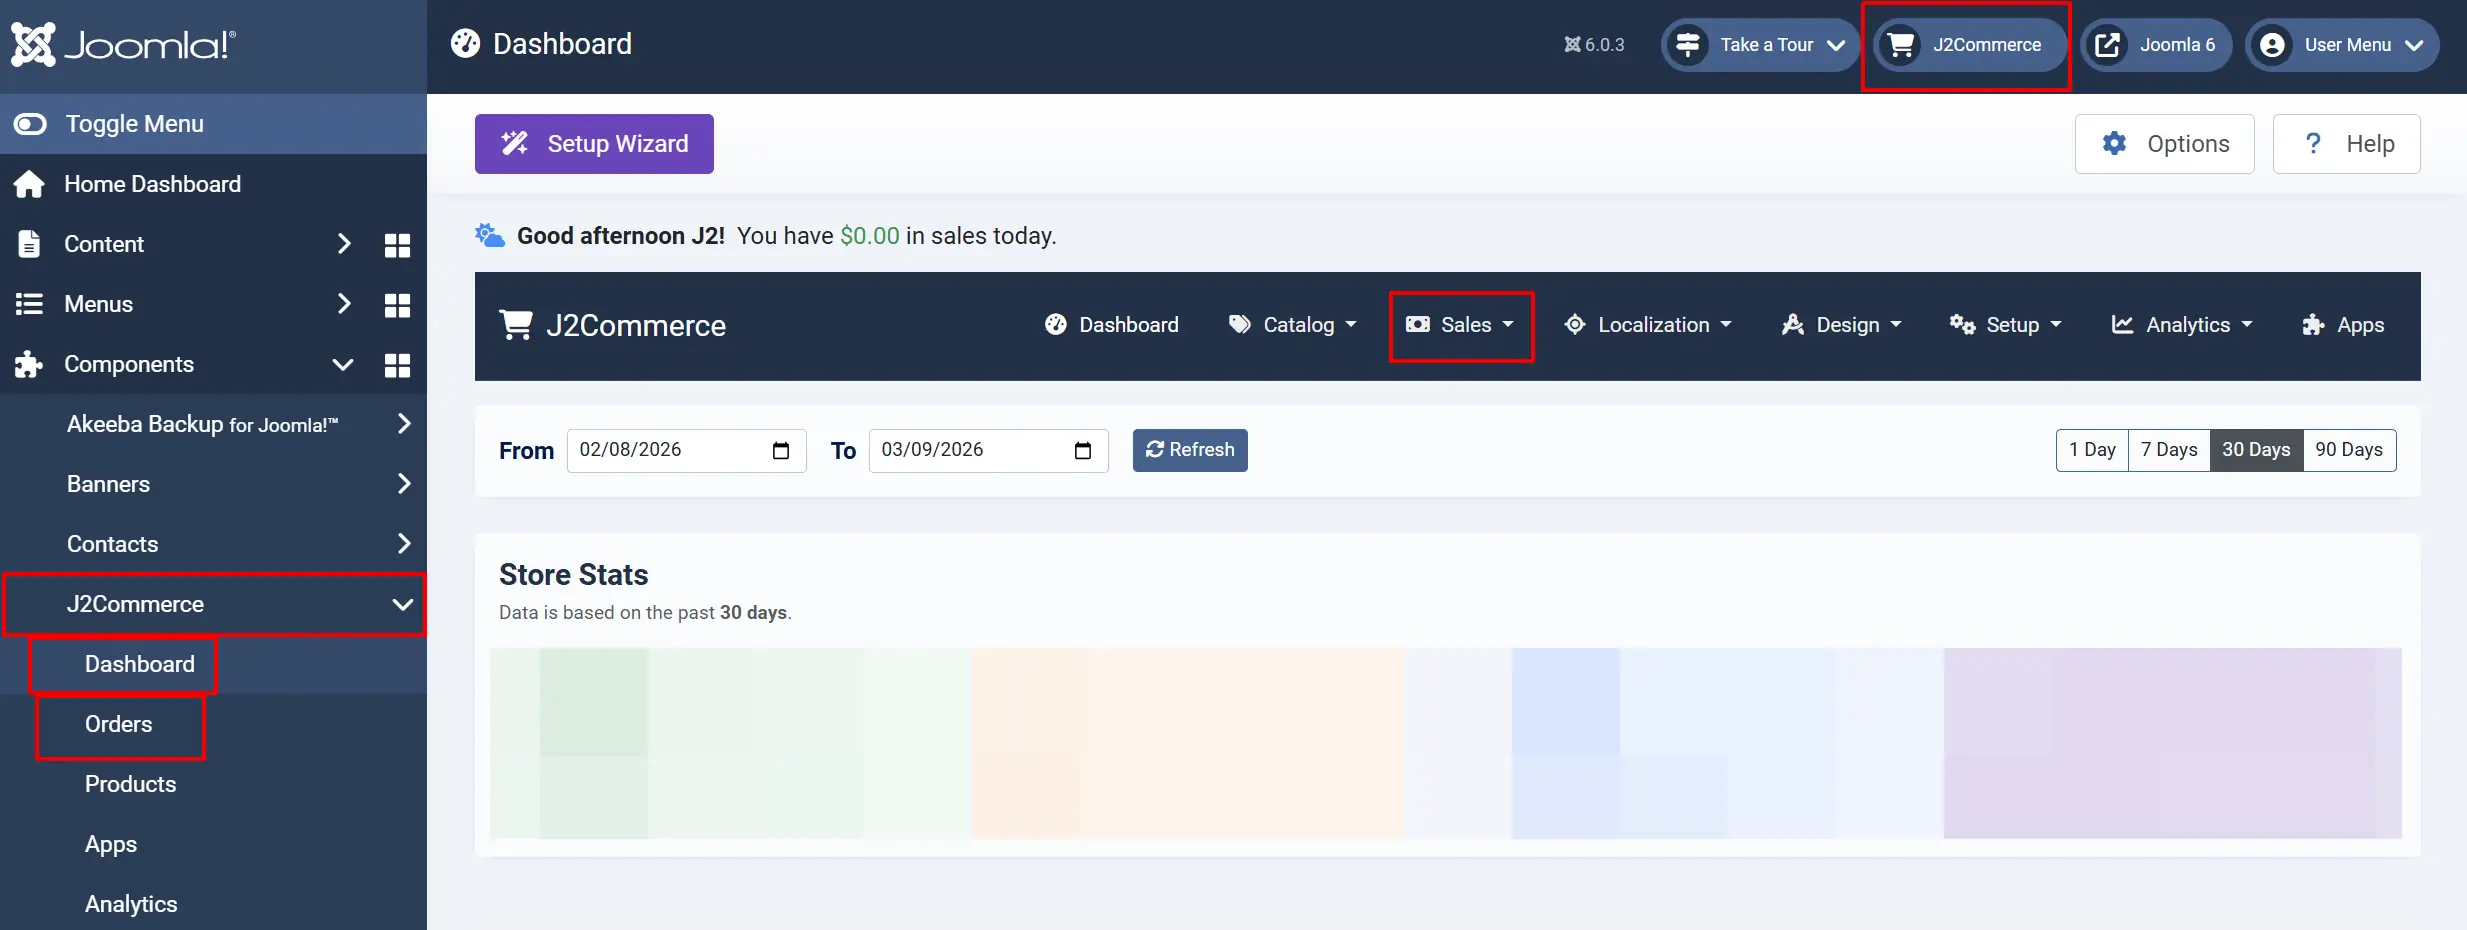
In the Joomla administrator, there are three different ways to access your dashboard at any time.
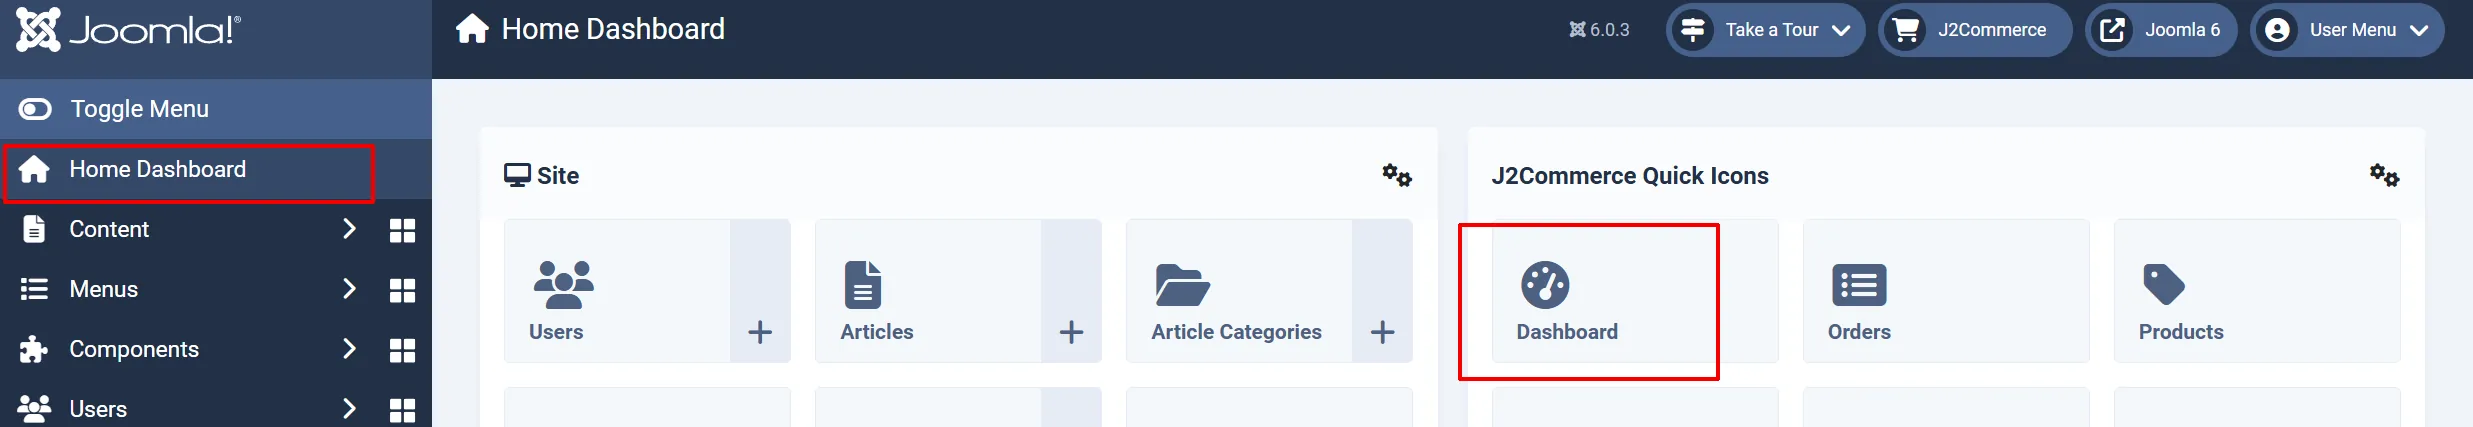
1: The left side bar: Home Dashboard -> Dashboard
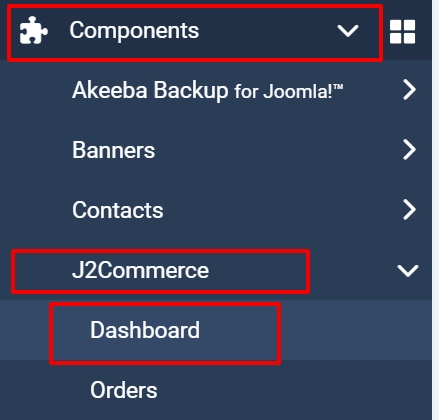
2: The left side bar: Components -> J2Commerce -> Dashboard
3: The Top bar: J2Commerce -> Dashboard

The direct URL is:
index.php?option=com_j2commerce&view=dashboard
Prerequisites
Before the dashboard displays meaningful data, make sure that:
-
J2Commerce is installed and the required system and content plugins are enabled.
-
At least one order exists in your store. Without orders, all KPI values (Store Stats) and charts will show zero.
-
Your website timezone is correctly set in System -> Global Configuration -> Server tab -> Website Time Zone. All dashboard reporting depends on this setting (see Timezone and Reporting below).
Page Layout
The dashboard sections appear in this order from top to bottom: Each one will be explained in the next section
- Toolbar -- page title, Setup Guide button, Preferences, Help
- Navigation bar -- links to all major J2Commerce admin sections
- Date filter bar -- date range picker with preset buttons
- KPI cards (Store Stats) -- four date-filtered metrics with trend arrows
- Dashboard messages -- notification carousel (only when plugins provide messages)
- Charts -- Daily Sales (left, 2/3 width) and Monthly/Yearly Sales (right, 1/3 width)
- Module tab rows -- additional module content below the charts
- Plugin quick icons -- shortcut tiles from app plugins
- Bottom module position -- full-width area for extra modules
- Store Setup Wizard -- offcanvas panel (only when setup is incomplete)
Toolbar

The toolbar at the top of the dashboard contains:
| Button | Icon | Who Sees It | What It Does |
|---|---|---|---|
| Dashboard | Tachometer | Everyone | Page title (not clickable) |
| Setup Guide | Wand (purple) | Everyone, until setup is complete | Opens the Store Setup Guide panel |
| Options | Gear | Super Admins only | Opens the J2Commerce component configuration |
| Help | Question mark | Everyone | Links to the J2Commerce documentation site |
The purple Setup Wizard button disappears once all setup checks pass or are dismissed.
Navigation Bar

The navigation bar sits below the toolbar on every J2Commerce admin page. It provides direct links to Dashboard, Products, Orders, Customers, Catalog, Shipping, Payments, Apps, Reports, and more. The currently active section is highlighted.
Date Filter Bar

The date filter controls which orders are included in the KPI cards and the Daily Sales chart. It does not affect the Monthly Sales or Yearly Sales charts, which always show all-time data.
Using the Date Filter
- In the date filter card at the top of the dashboard, enter dates in the From and To fields, or click one of the preset buttons.
- Click the Refresh button. The KPI cards (Store Stats) and Daily Sales chart update instantly via AJAX -- no page reload required.
Date Presets
| Button | Range | Notes |
|---|---|---|
| 1 Day | Today (and the previous day) | Includes the previous day so the chart has two data points and can draw a line rather than a single dot |
| 7 Days | Last 7 days | Rolling 7-day window ending today |
| 30 Days | Last 30 days | Default -- this is the active preset when you first open the dashboard |
| 90 Days | Last 90 days | Useful for quarterly reviews |
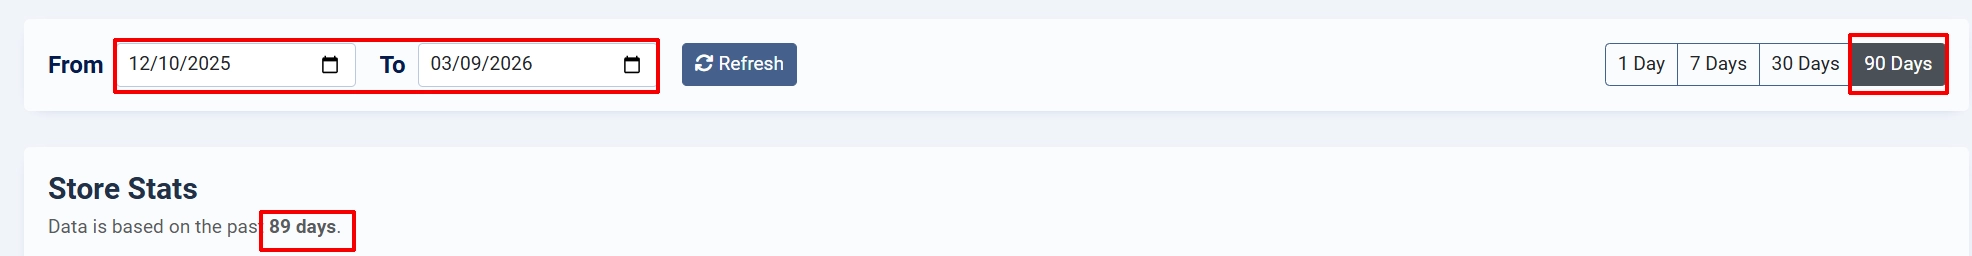
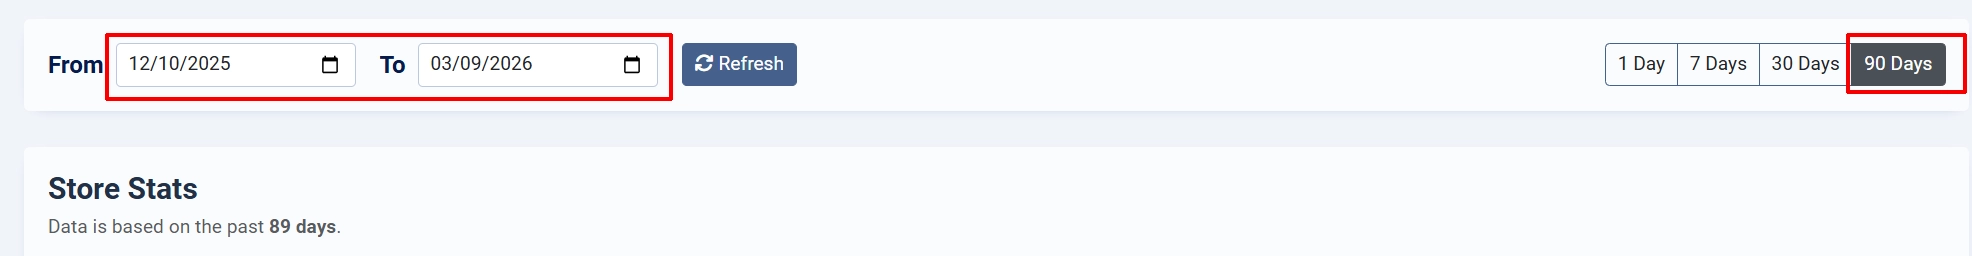
Clicking a preset button immediately sets the From and To fields and triggers a refresh.
NOTE: When you click on 1/7/30/90 days, the date range and number of days will automatically change. See the image below.

KPI Cards (Store Stats)

Four color-coded cards sit below the date filter. They summarize your store's performance for the selected date range. Each card also displays a percentage change compared to the equivalent period immediately before your selected range.
For example, if you select the last 30 days, the percentage arrow compares those 30 days against the 30 days before them.
| Card | Color | What It Shows | Example |
|---|---|---|---|
| Total Revenue | Green | Sum of completed order totals | $12,450.00 |
| Orders | Yellow | Number of completed orders | 87 |
| Conversion Rate | Blue | (Completed orders / total sessions) x 100 | 3.2% |
| Sessions | Purple | Distinct user sessions tracked in analytics | 2,718 |
Percentage Change Arrows
Each card can show one of three states:
- Up arrow with percentage -- the metric increased compared to the previous period.
- Down arrow with percentage -- the metric decreased.
- No arrow -- the previous period had zero activity for that metric, so no comparison is possible.
What Counts as Revenue
Only orders in one of these states are included in revenue and order count totals:
- Confirmed (order state 1)
- Processed (order state 2)
- Shipped (order state 7)
Orders in Pending, Cancelled, or other states are excluded from the KPI calculations.
Currency Formatting
Revenue values use the currency symbol and position configured in your J2Commerce store settings. If your currency symbol appears before the number (e.g., $100) or after it (e.g., 100 EUR), the dashboard follows the same format as your storefront. No separate configuration is needed.
Dashboard Messages

This section appears only when one or more plugins provide messages via the onJ2CommerceGetDashboardMessages event. Messages rotate automatically every 10 seconds using a Swiper carousel and pause when you hover over them.
Message Anatomy
Each message can include:
-
Type -- controls the alert color:
info(blue),warning(yellow),danger(red), orsuccess(green) -
Icon -- a Font Awesome icon displayed to the left of the text
-
Text -- the notification content
-
Action button -- an optional button linking to a configuration page (e.g., "Configure Now")
-
Dismiss options -- a dropdown with one or both of:
- Hide for this session -- the message disappears until you close your browser tab
- Don't show again -- the message is permanently hidden on that device (stored in your browser's local storage)
Common Message Examples
- A warning that your Download ID is not configured
- A notice that a payment gateway is in sandbox/test mode
- An informational banner about a new feature or available migration
If no plugins are providing messages, this section does not appear at all -- it takes up no space on the page.
Charts
Daily Sales Chart (Left Column -- 2/3 Width)

The Daily Sales tab displays a line chart with a filled area showing daily revenue for the selected date range. It updates whenever you change the date filter.
The chart groups revenue by day using your store's timezone. An order placed at 11:00 PM in your timezone appears on that day's data point, not on the following day in UTC.
Additional tabs may appear alongside Daily Sales if modules are assigned to the j2commerce-dashboard-main-tab position or if plugins inject tabs via the onJ2CommerceDashboardMainTabContent event. By default, the Order Statistics module (mod_j2commerce_stats) is assigned here, providing a tab with order count and revenue breakdowns.
Order Statistics Tab (mod_j2commerce_stats)
When the Order Statistics module is assigned to the main chart tab area, it shows a two-column table with order counts and revenue totals for:
| Left Column | Right Column |
|---|---|
| All-time total orders | This month |
| Last year | Last 7 days |
| This year | Yesterday |
| Last month | Today (bold) |
Below the table, a Daily Average row shows the average order count and revenue per day for the current month.
Monthly Sales and Yearly Sales Charts (Right Column -- 1/3 Width)

The right column holds two tabs:
- Monthly Sales -- Bar chart showing Revenue, Orders, and Items sold by calendar month. Displays all-time data, unaffected by the date filter.
- Yearly Sales -- Bar chart showing Revenue, Orders, and Items sold by year. Also all-time data.
Switch between the two tabs by clicking the tab labels above the chart.
Both Monthly and Yearly charts include items sold (the total quantity of products in completed orders), which is calculated from order line items.
Module Positions
The dashboard provides five module positions where you can add custom content by assigning Joomla administrator modules. The first four positions render modules as tabs (each module gets its own clickable tab); the fifth renders modules as standard output.
The 'Assigning a Module to a Dashboard Position' section below it will explain how to add new tabs
| Position Name | Location | Rendering Style |
|---|---|---|
j2commerce-dashboard-main-tab | Left chart column -- alongside the Daily Sales tab | Tabbed |
j2commerce-dashboard-side-tab | Right chart column -- alongside Monthly/Yearly tabs | Tabbed |
j2commerce-dashboard-module-main-tab | Below the charts, left side | Tabbed |
j2commerce-dashboard-module-side-tab | Below the charts, right side | Tabbed |
j2commerce-module-bottom | Full width at the very bottom of the dashboard | Standard (not tabbed) |
Layout Behavior
When both j2commerce-dashboard-module-main-tab and j2commerce-dashboard-module-side-tab have modules assigned, they display side by side at equal width (50% each). If only one of those positions has modules, it stretches to full width.
The chart-area positions (main-tab and side-tab) always maintain their 2/3 and 1/3 width split regardless of how many modules are assigned.
Assigning a Module to a Dashboard Position
-
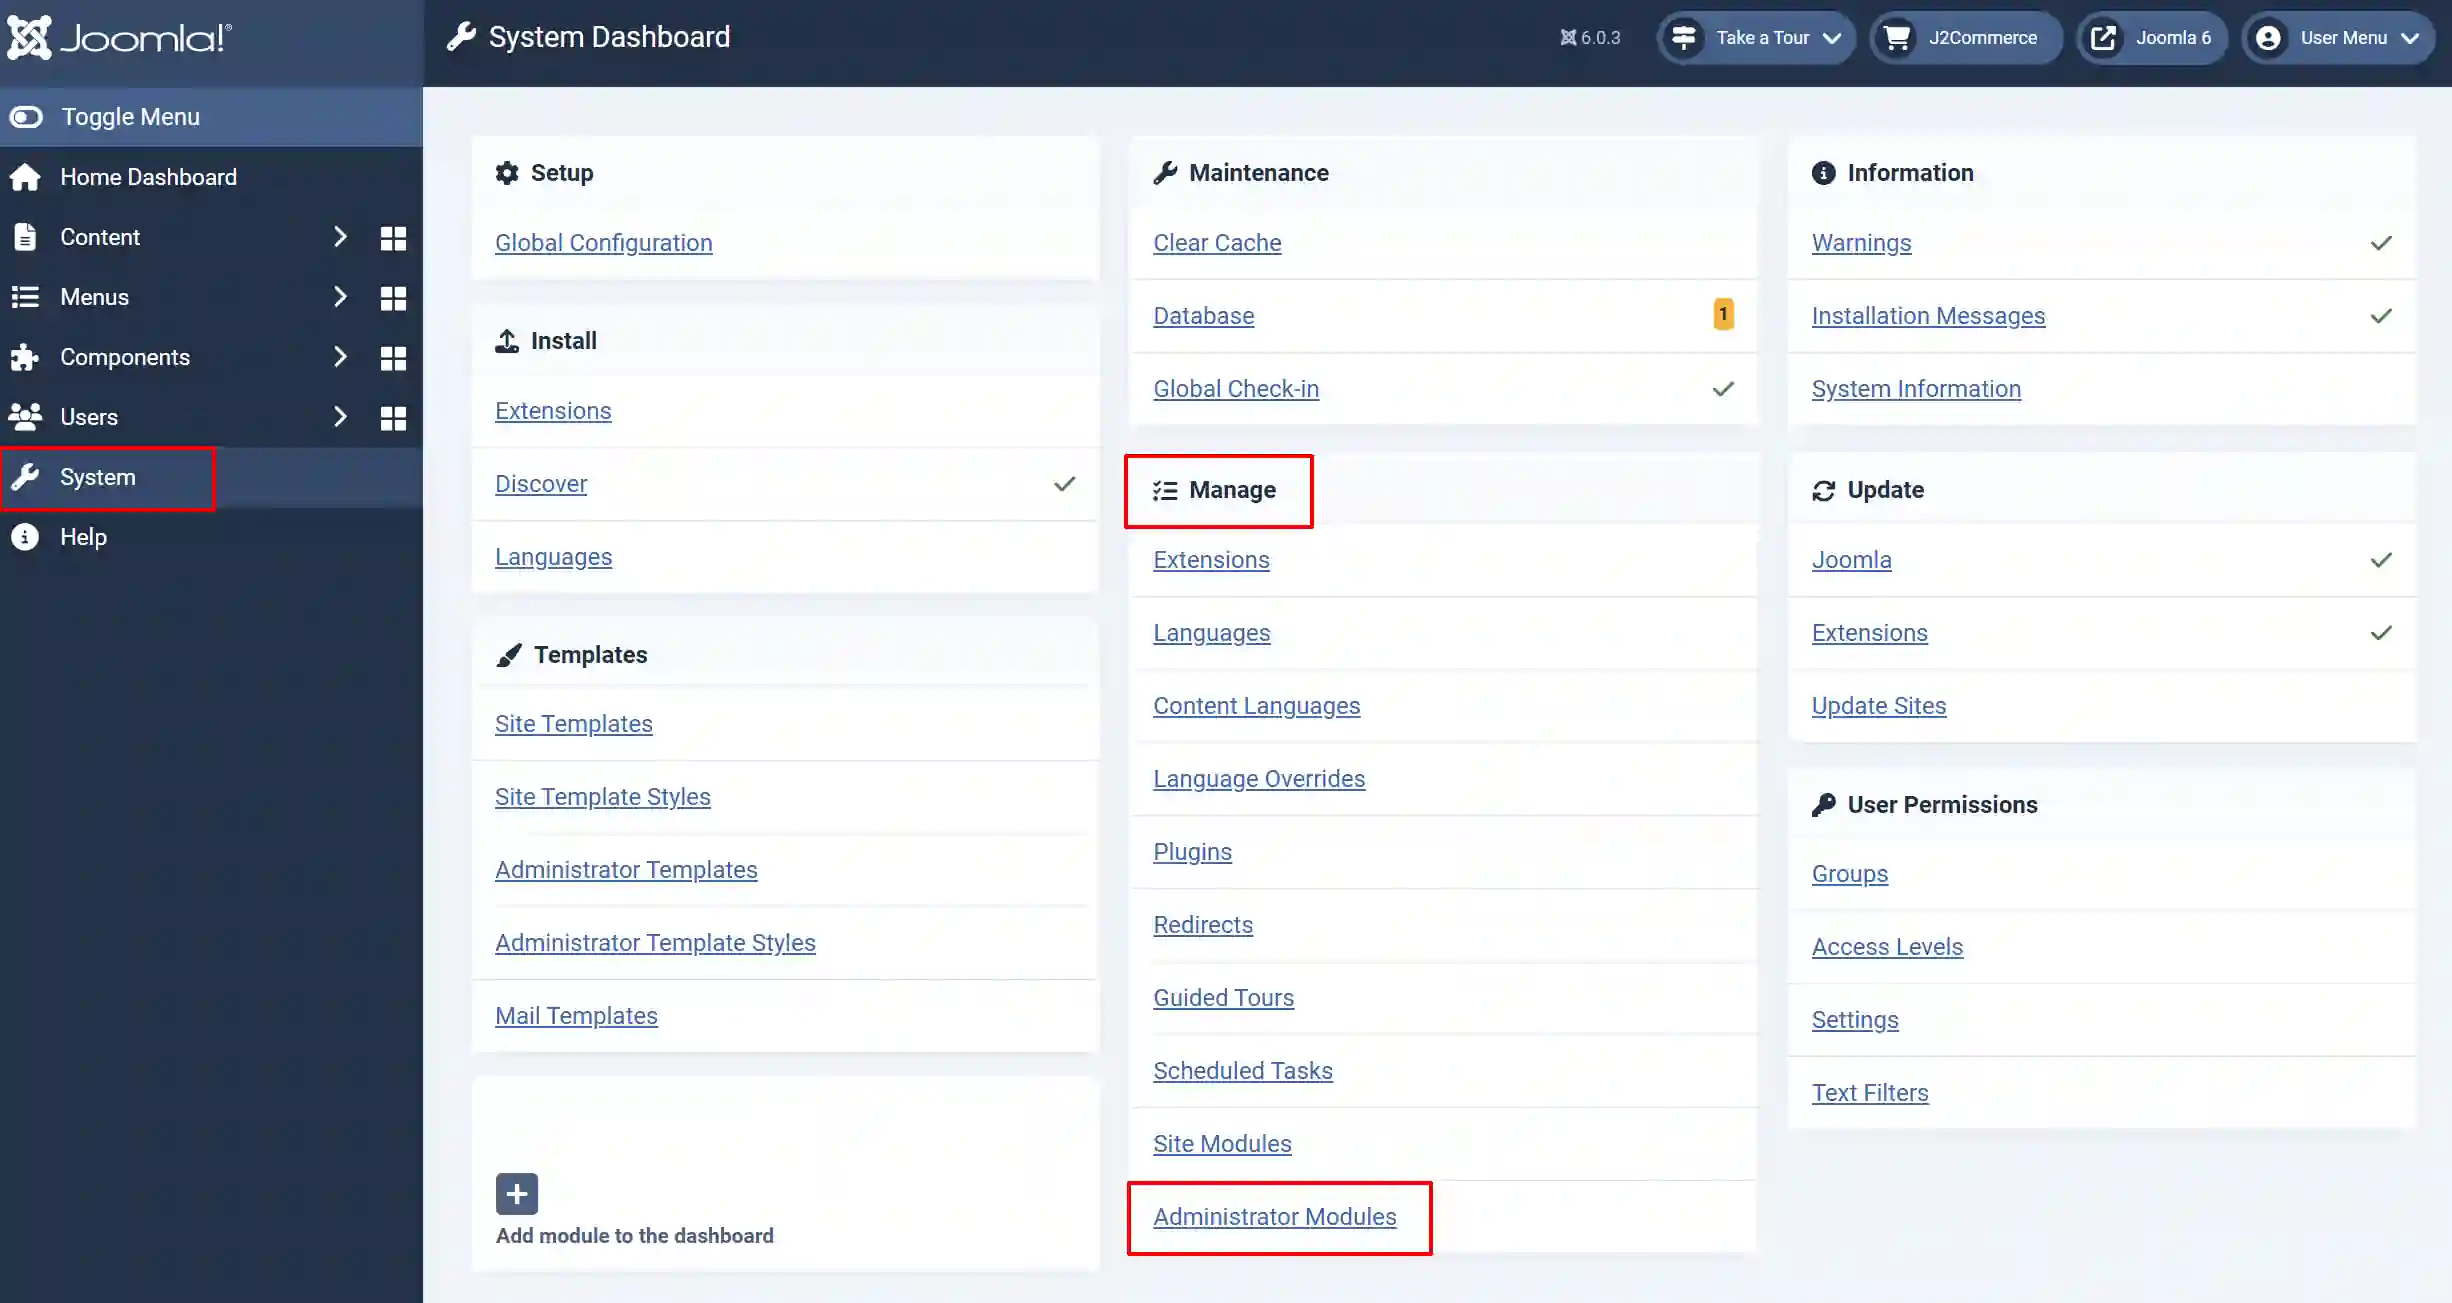
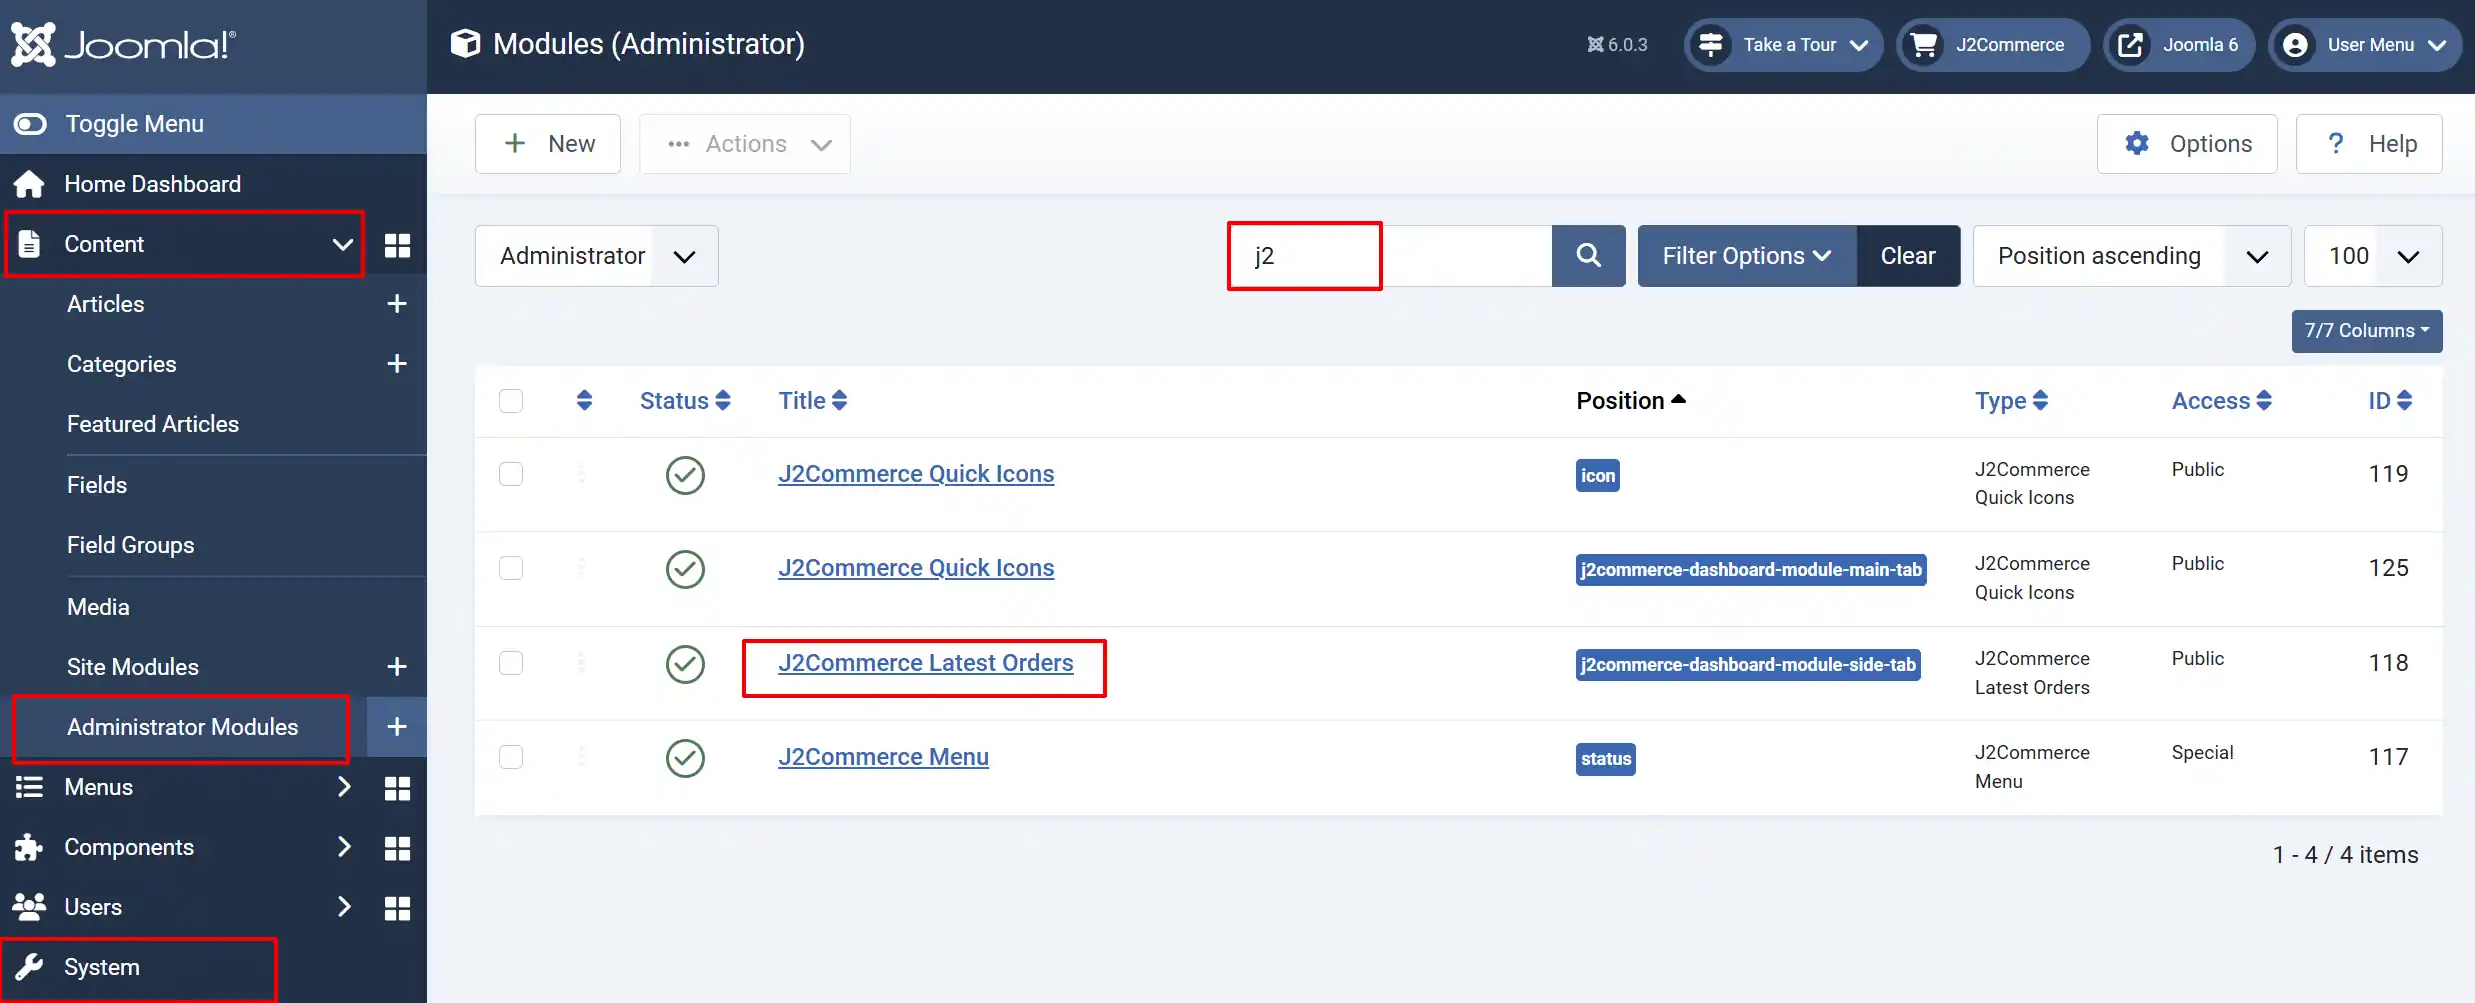
In the Joomla administrator, go to System -> Manage -> Administrator Modules
infoNOTE: Another way to get there is in the sidebar, go to Content -> Administrator Modules, (depending on your Joomla version)

-
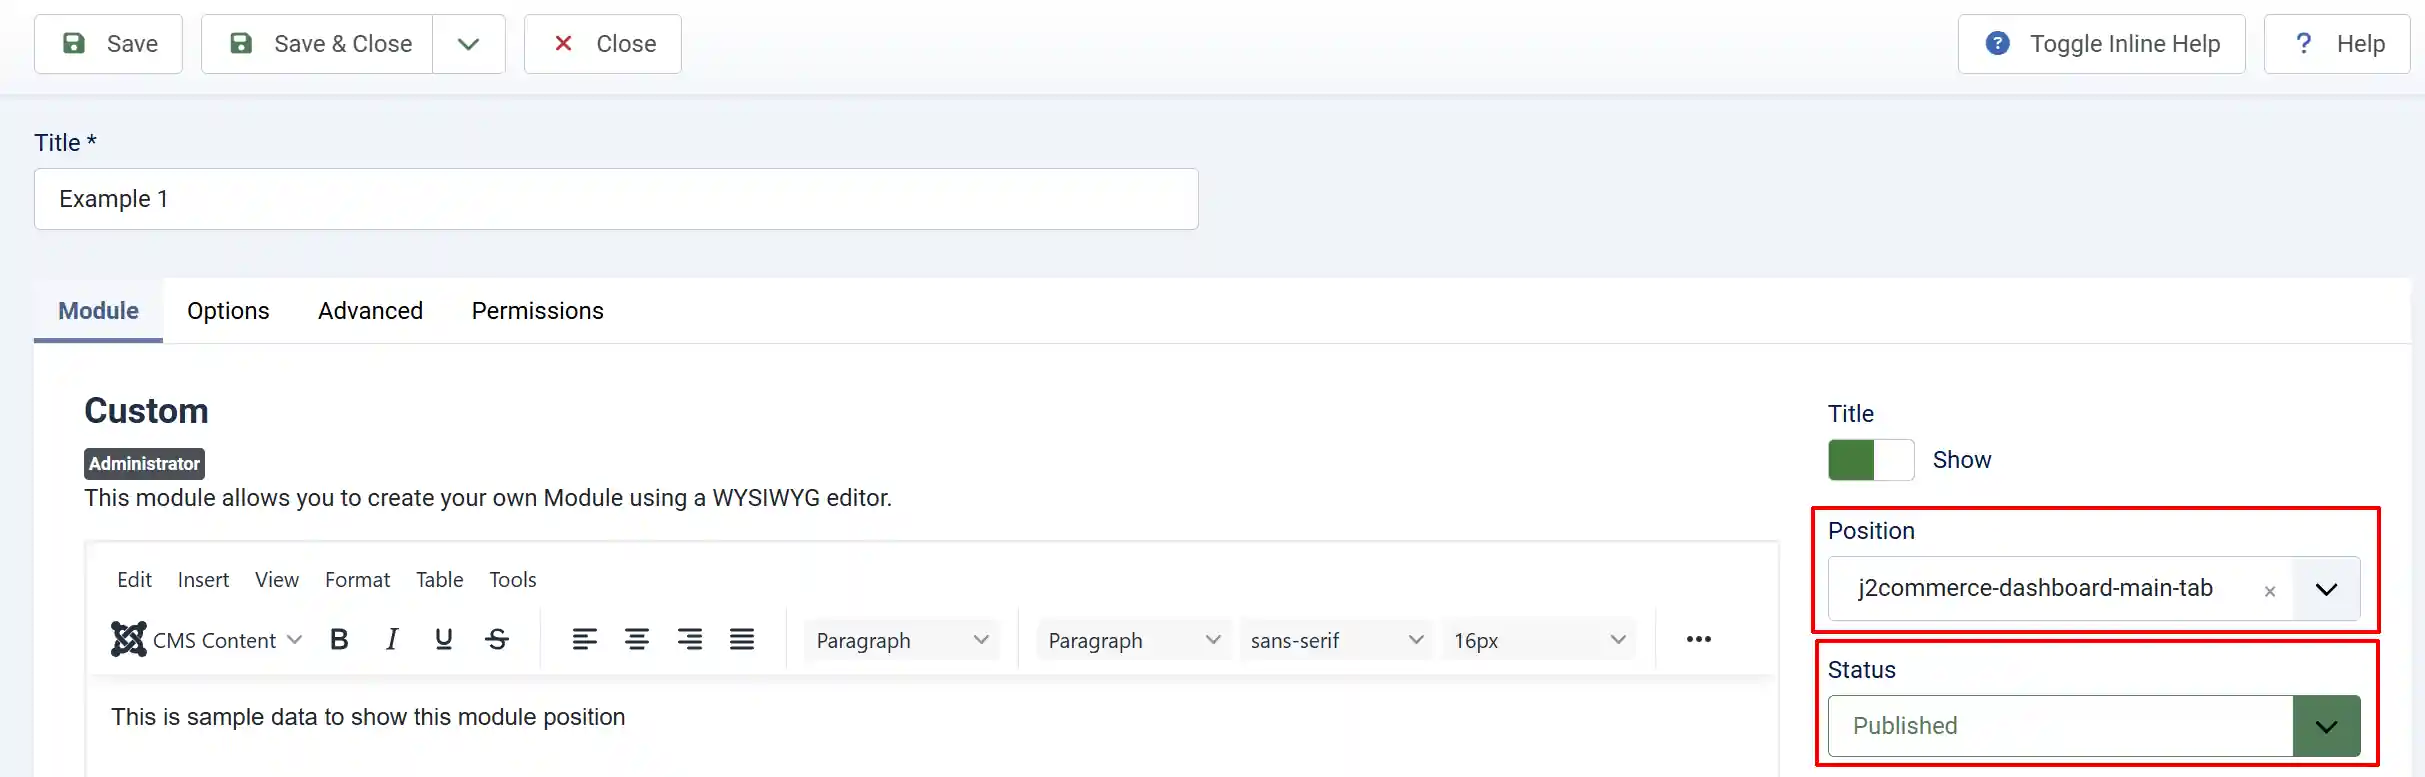
Click New -> Custom module type to create a new module, or open an existing module you want to place on the dashboard.
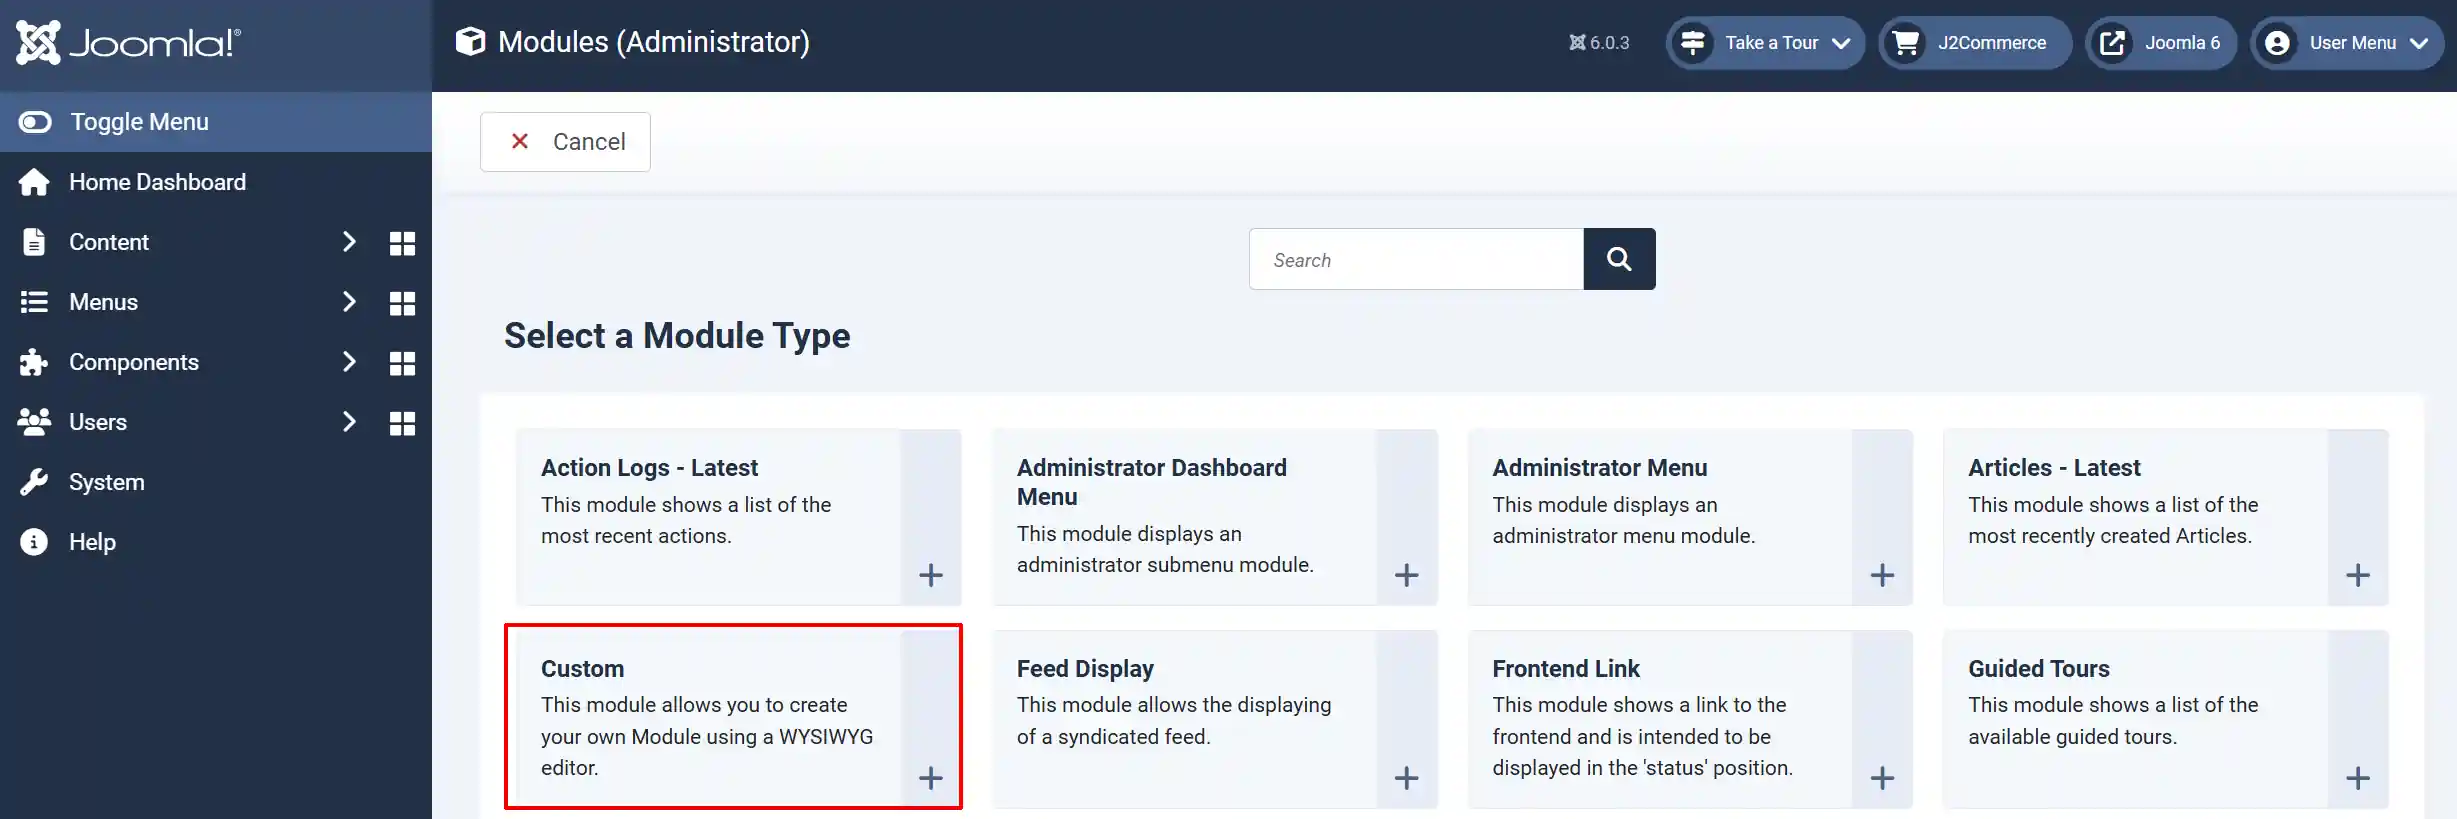
-
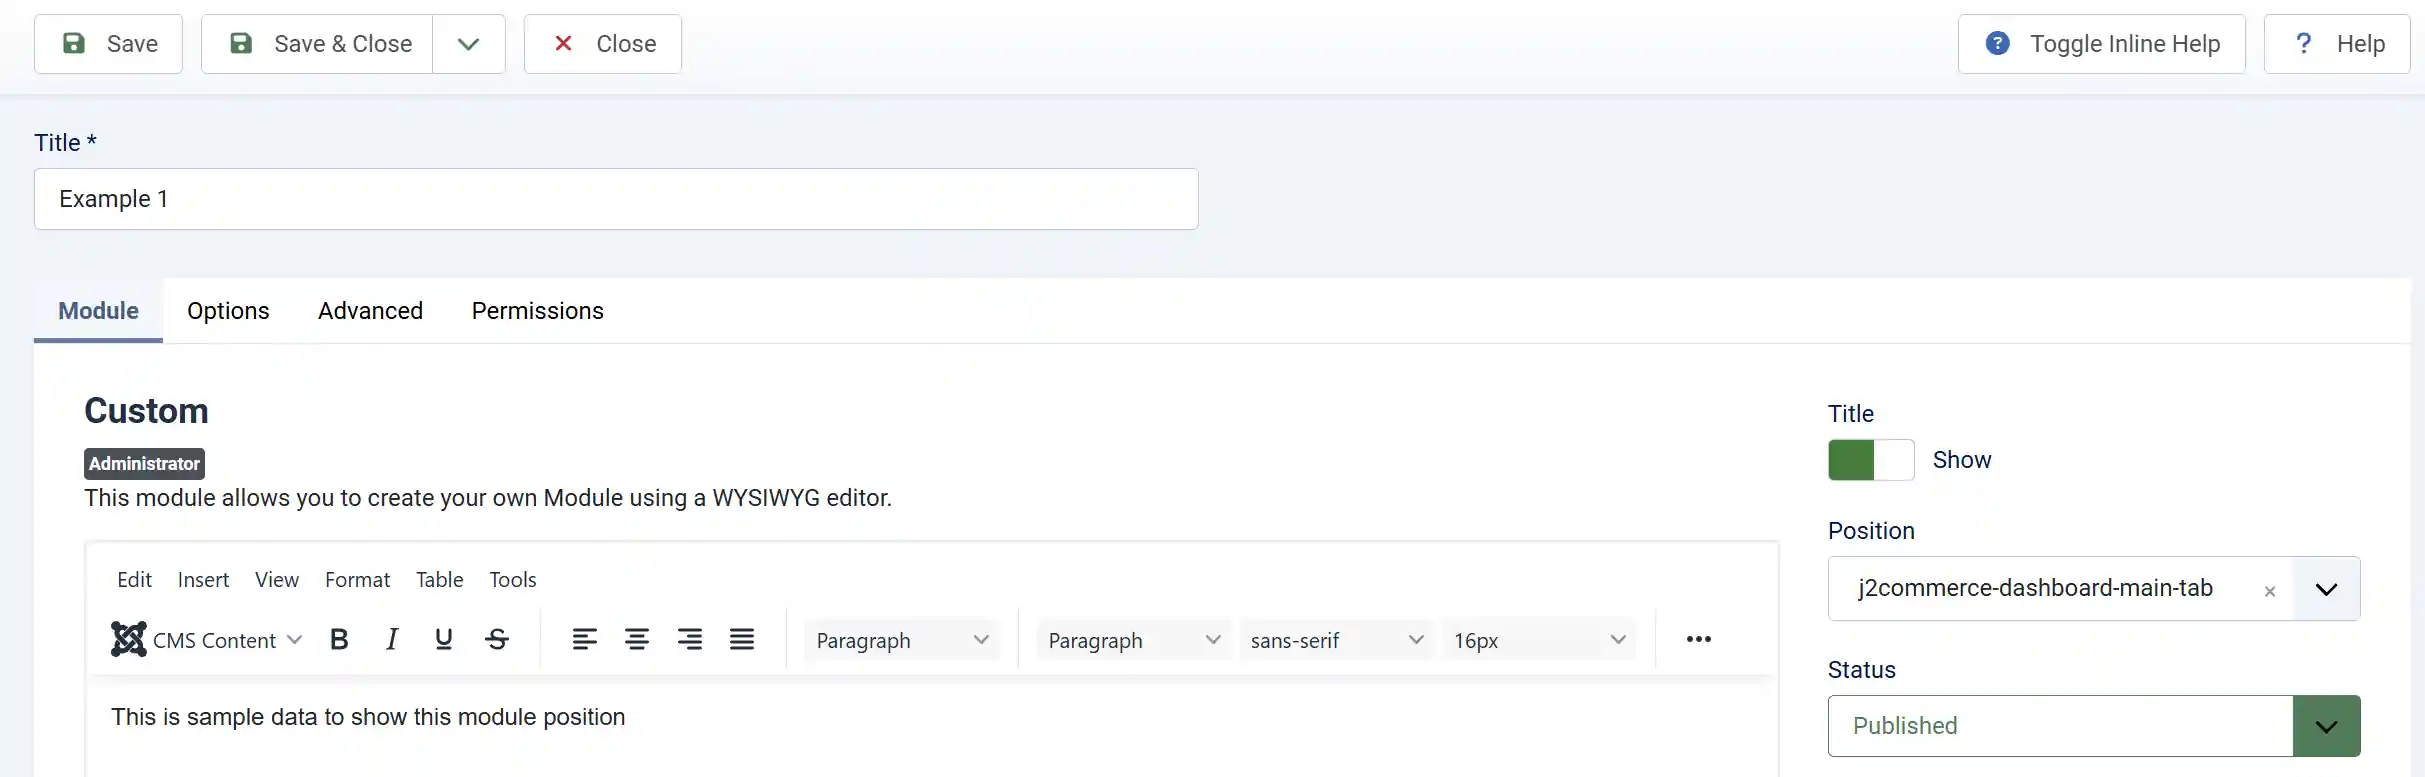
Name the module (for this section, we will call it example 1, but you can name it anything you want)
-
Whatever you put in the content section, you will see in the dashboard. ie, content, charts, etc.
-
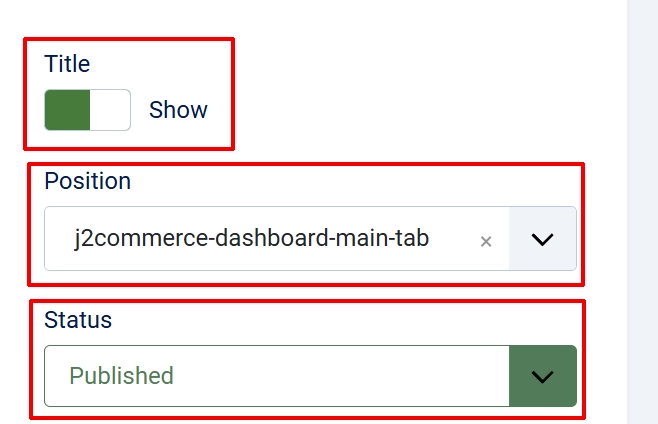
In the Module tab, set the Position field to one of the position names listed above (e.g.,
j2commerce-dashboard-main-tab). You may need to type the position name manually if it does not appear in the dropdown. -
Ensure the module Status is set to Published.

-
Click Save & Close.
The module will appear as a new tab (or inline content, for the bottom position) on the J2Commerce dashboard the next time you load it.

Default Module Assignments
A fresh J2Commerce installation includes these modules pre-assigned to dashboard positions:
| Module | Position |
|---|---|
J2Commerce Order Statistics (mod_j2commerce_stats) | j2commerce-dashboard-main-tab |
J2Commerce Latest Orders (mod_j2commerce_orders) | j2commerce-dashboard-module-side-tab |
J2Commerce Quick Icons (mod_j2commerce_quickicons) | j2commerce-dashboard-module-main-tab |
Quick Icons
Quick icons appear in two places on the dashboard:
![]()
Built-in Quick Icons (mod_j2commerce_quickicons)
The J2Commerce Quick Icons module (mod_j2commerce_quickicons) provides shortcut tiles for the most commonly used admin sections. By default, it is assigned to the j2commerce-dashboard-module-main-tab position and shows the following icons:
| Icon | Links To | Show/Hide Parameter |
|---|---|---|
| Dashboard | J2Commerce Dashboard | show_dashboard (hidden when you are already on the dashboard) |
| Orders | Orders list | show_orders |
| Products | Products list | show_products |
| Customers | Customers list | show_customers |
| Apps | Apps/Extensions list | show_apps |
| Payment Methods | Payment methods list | show_payment |
| Shipping Methods | Shipping methods list | show_shipping |
| Statistics | Analytics/Statistics view | show_statistics |
| Reports | Reports view | show_reports |
| Configuration | Component configuration | show_config |
Each icon can be individually shown or hidden in the module's parameters. To configure which icons will appear:
-
Go to System -> Manage -> Administrator Modules.
infoNOTE: Another way to get there is in the sidebar, go to Content -> Administrator Modules, (depending on your Joomla version)
-
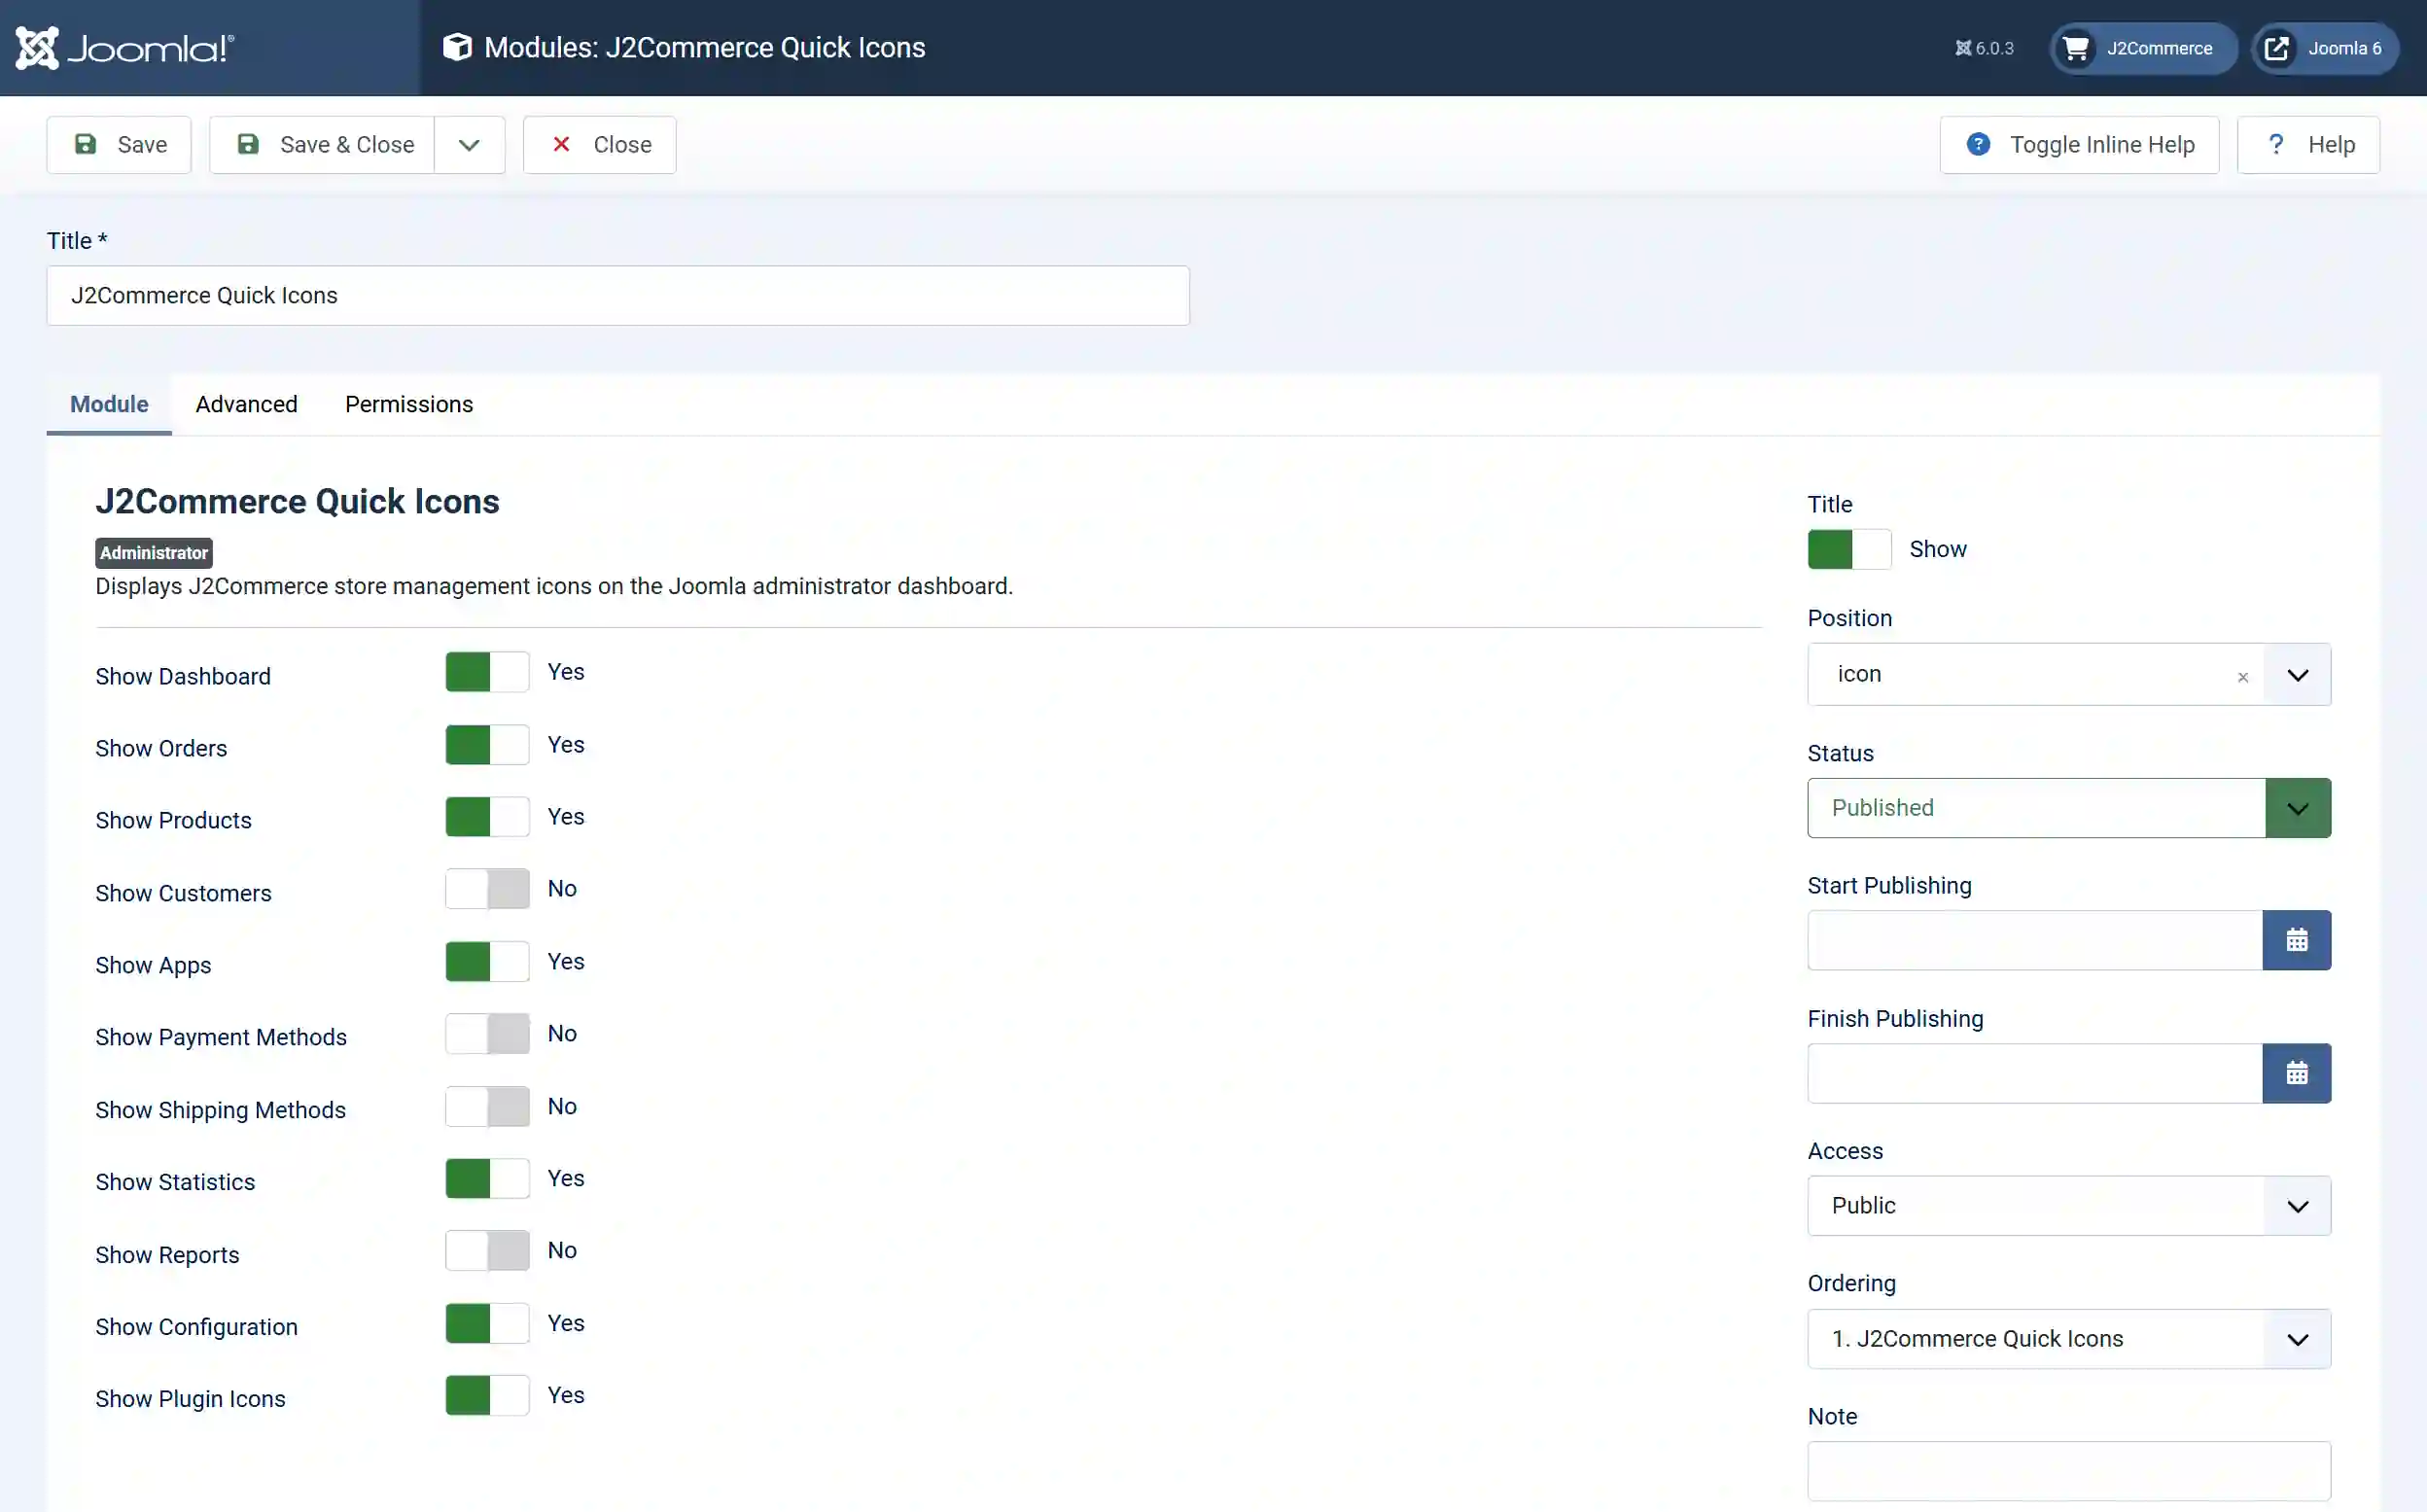
Find and open J2Commerce Quick Icons.
-
Toggle the show/hide switches for each icon type.
-
Click Save & Close.
The module also has a Show Plugin Icons parameter. When enabled, third-party J2Commerce plugins that implement the onJ2CommerceGetQuickIcons event can add their own icon tiles alongside the built-in ones.
Plugin Quick Icons (Separate Section)
In addition to the module-based quick icons, the dashboard has a standalone Plugin Quick Icons section that appears between the module tab rows and the bottom module position. This section only renders when app plugins provide icons via the onJ2CommerceGetQuickIcons event with the j2commerce_dashboard context.
Each icon tile can include:
- A link to a specific admin page
- Label text
- A Font Awesome icon
- A color style (e.g., success, warning, danger)
- An optional badge count that updates automatically via AJAX polling
NOTE: If no plugins provide icons for this section, it does not appear.
Live Users
The dashboard tracks currently active frontend visitors by querying the Joomla session table for sessions active within the last 30 minutes. The data includes:
- Total active sessions (guests + registered users combined)
- Guests -- anonymous visitors without a Joomla account
- Registered -- logged-in customers
Up to 10 registered users are listed by name, ordered by most recent activity. This information refreshes periodically via AJAX in the background and does not require any configuration from you.
Only genuine frontend activity (customer browsing) is counted. Backend admin sessions are excluded.
Recent Orders (mod_j2commerce_orders)

The J2Commerce Latest Orders module shows a table of the most recent orders. By default, it displays the 5 most recent orders and is assigned to the j2commerce-dashboard-module-side-tab position. Each row shows:
| Column | Description |
|---|---|
| Order ID | Clickable link that opens the order detail view |
| Date | Order creation date (visible on larger screens) |
| Customer | Billing name and email |
| Status | Order status badge (color-coded) |
| Total | Order total in the order's currency |
Module Parameters
| Parameter | Default | Description |
|---|---|---|
| Limit | 5 | Number of recent orders to display (1--50) |
| Filter by Status | Confirmed | Show only orders matching selected statuses. Choose "All Statuses" to show every order regardless of state. |
To configure this module, go to System -> Manage -> Administrator Modules, search for J2Commerce Latest Orders, and adjust the parameters.
NOTE: Another way to get there is in the sidebar, go to Content -> Administrator Modules, (depending on your Joomla version)
Setting Up Your Store (Store Wizard)

The Store Setup Wizard is an onboarding tool that helps you configure everything your store needs to go live. It appears as a purple Setup Wizard button in the toolbar whenever your setup is not yet complete.
Opening the Setup Wizard
Click the purple Setup Wizard button in the toolbar. A panel slides in from the right side of the screen (400px wide).
Each section in the sidebar will let you know what information has been completed or is still missing from your store
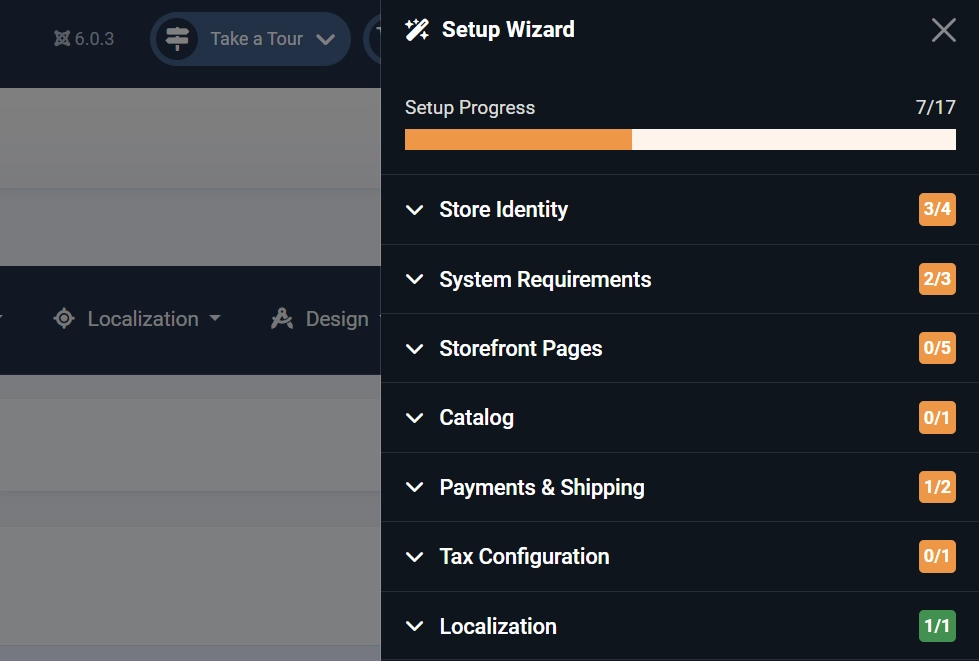
Setup Progress Bar
At the top of the panel, a progress bar shows your overall completion percentage and a count (e.g., "12 of 17 complete"). The bar fills as you complete or dismiss checks.
Check Groups
The 17 built-in checks are organized into 7 groups:
| Group | Checks | What They Verify |
|---|---|---|
| Store Identity | Store Address, Admin Email, Store Logo, Timezone | Your store's basic contact and branding information is configured |
| System Requirements | System Plugin, Content Plugin, Uppy Plugin | The required J2Commerce plugins are installed and enabled |
| Storefront Pages | Checkout Page, Cart Page, My Profile Page, Confirmation Page | Menu items exist for the essential storefront pages |
| Catalog | Category Menu Item, First Product | At least one product category menu item and one product exist |
| Payments and Shipping | Payment Method, Shipping Method | At least one payment and one shipping method are configured |
| Tax Configuration | Tax Profile | A tax profile is set up |
| Localization | Countries | Countries are configured for shipping zones |
How to View the Status
-
Click a group name to expand it and see the individual checks within that group.
-
Click a failed check (shown with a red indicator) to open its detail view. The detail view explains what is missing and offers action buttons:
- Enable -- enables a disabled plugin directly from the guide
- Create -- takes you to the page where you can create the missing item (e.g., a menu item)
- Configure -- opens the relevant configuration screen
-
After completing an action, return to the Setup Wizard to see the check turn green.
Check Status Indicators
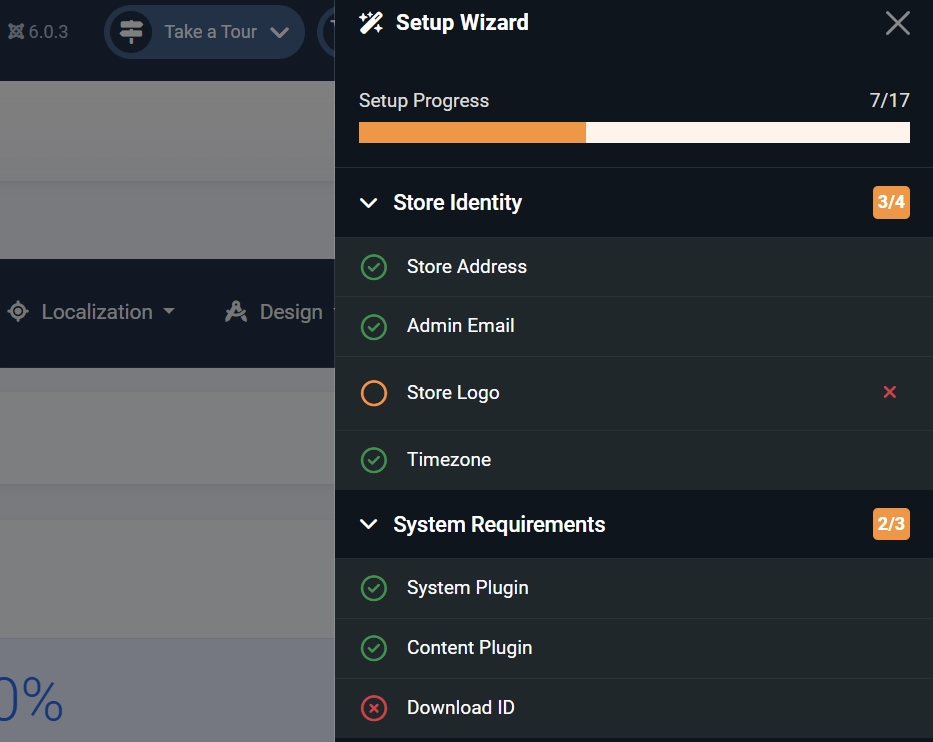
| Indicator | Meaning |
|---|---|
| Green checkmark | Passed -- this item is correctly configured |
| Red X | Failed -- action required before your store is ready |
| Grey line | Dismissed -- you have chosen to skip this check |
| Orange circle | Incomplete -- missing information |
Dismissing Checks
If a check does not apply to your store (for example, you do not need shipping because you only sell digital products), click the Dismiss button on that check's detail view. Dismissed checks count as "complete" for progress calculation purposes.
Dismissed checks are stored in the component configuration. To un-dismiss a check, you would need to clear the corresponding setup_dismissed_* entry in the component parameters.
Completion
Once all 17 checks pass or are dismissed:
- The progress bar reaches 100%.
- An "All Done!" banner appears in the panel.
- The purple Setup Guide button disappears from the toolbar.
Third-Party Checks
Plugins can add custom setup checks via the onJ2CommerceGetSetupChecks event. These appear alongside the built-in checks and follow the same pass/fail/dismiss behavior.
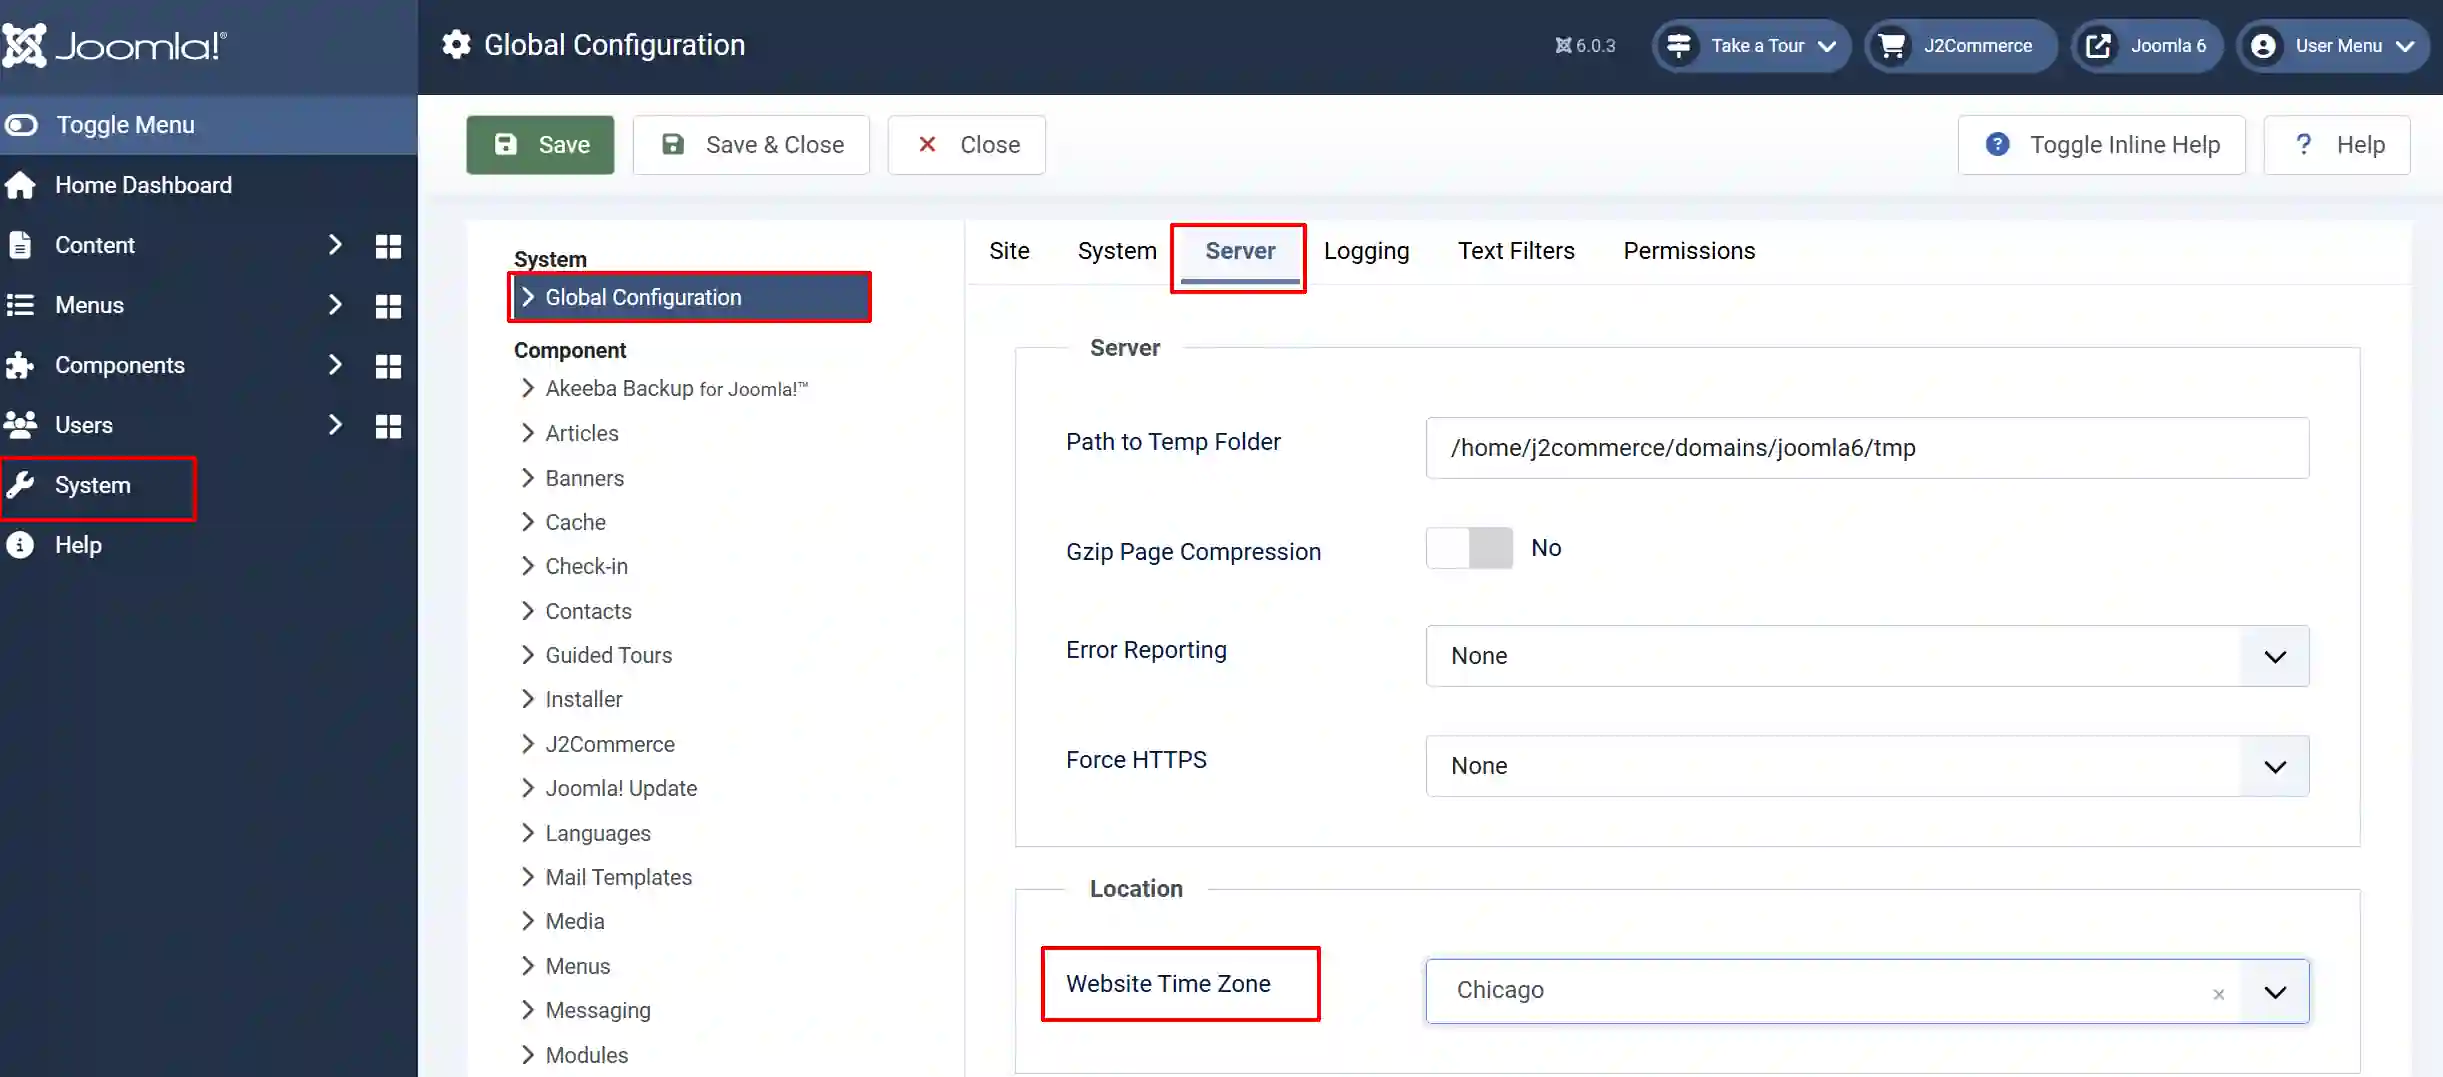
Time Zone and Reporting
The dashboard uses the time zone configured in System -> Global Configuration -> Server tab -> Website Time Zone.

All order timestamps are stored in UTC in the database. When you select a date range, the dashboard converts your local-time day boundaries to UTC before querying the database.
NOTE: UTC is set as the default; however, it is recommended that you change it to your timezone in the dropdown. It is also recommended to set up your time zone here before you start receiving orders, so all of your reports are on the same time zone from the beginning.
This means:
- Selecting "February 1" as the start date queries from 00:00:00 February 1 in your local time zone, not 00:00:00 UTC.
- Revenue totals and daily chart groupings reflect your store's local time zone throughout.
- The Monthly Sales and Yearly Sales charts also use time zone-aware grouping via MySQL's
CONVERT_TZfunction.
If the time zone is set incorrectly, daily totals may shift -- orders could appear on the wrong day and date-range totals may not match your expectations.
Recommendation: Verify your timezone in Global Configuration before relying on dashboard reports. If you change the time zone after your store has been running, past data will be re-grouped according to the new time zone the next time you load the dashboard.
Tips
-
The date filter updates only the KPI cards (Sales Stats) and the Daily Sales chart. Monthly and Yearly charts always show all-time figures.
-
The 30 Days preset is the default. Click it at any time to reset to the standard view.
-
When you click on 1/7/30/90 days, the date range and number of days will automatically change. See the image below.
-
-
Revenue figures use the same currency formatting as your storefront -- no separate dashboard configuration is needed.
-
If a KPI card (Store Stats) shows no percentage change arrow, the previous period had zero activity for that metric (so no comparison is possible).
-
Assign custom report modules to
j2commerce-dashboard-main-tabadd analytics tabs alongside the built-in Daily Sales chart. -
The Dashboard quick icon
mod_j2commerce_quickiconsautomatically hides itself when you are already viewing the dashboard, to avoid a redundant link. -
Module tab positions support multiple modules per position. Each module gets its own tab.
Troubleshooting
KPI values show zero, even though I have orders
Cause: The selected date range may not include any orders, or your orders may be in a status that is excluded from revenue calculations (such as Pending or Cancelled).
Solution:
-
Widen the date range using the 90 Days preset or enter custom dates covering the period when orders were placed.
-
Check order statuses in J2Commerce -> Orders. Only Confirmed (1), Processed (2), and Shipped (7) orders count toward revenue.
Note: There are three different ways to check your orders:
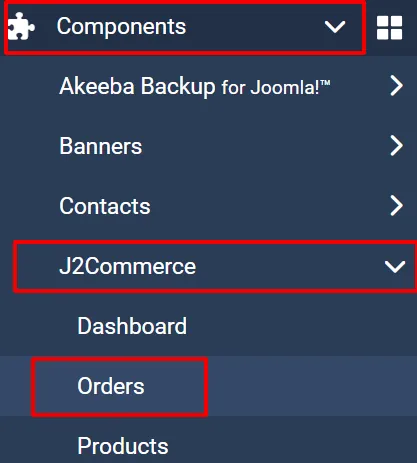
a: Click on J2Commerce icon at the top right corner -> Sales -> Orders
b: From your Dashboard view, click on Sales -> Orders
c: Left sidebar, Components -> J2Commerce -> Orders
Daily totals appear shifted by several hours
Cause: The server timezone in Joomla Global Configuration does not match your store's actual local timezone.
Solution:
-
Go to System -> Global Configuration -> Server tab.
-
Set Website Time Zone to your store's local time zone (for example,
America/ChicagoorEurope/London).
-
Click Save and return to the dashboard.
The Setup Wizard button is gone, but my store is not fully configured
Cause: All checks were dismissed (not necessarily completed), which also hides the toolbar button. Dismissed checks count as "complete" for progress purposes.
Solution: This is by design. If you need to revisit setup, navigate directly to the relevant configuration area via the J2Commerce navigation bar (for example, if you want to set up the payment methods, go to Components -> J2Commerce -> Setup -> Payment Methods
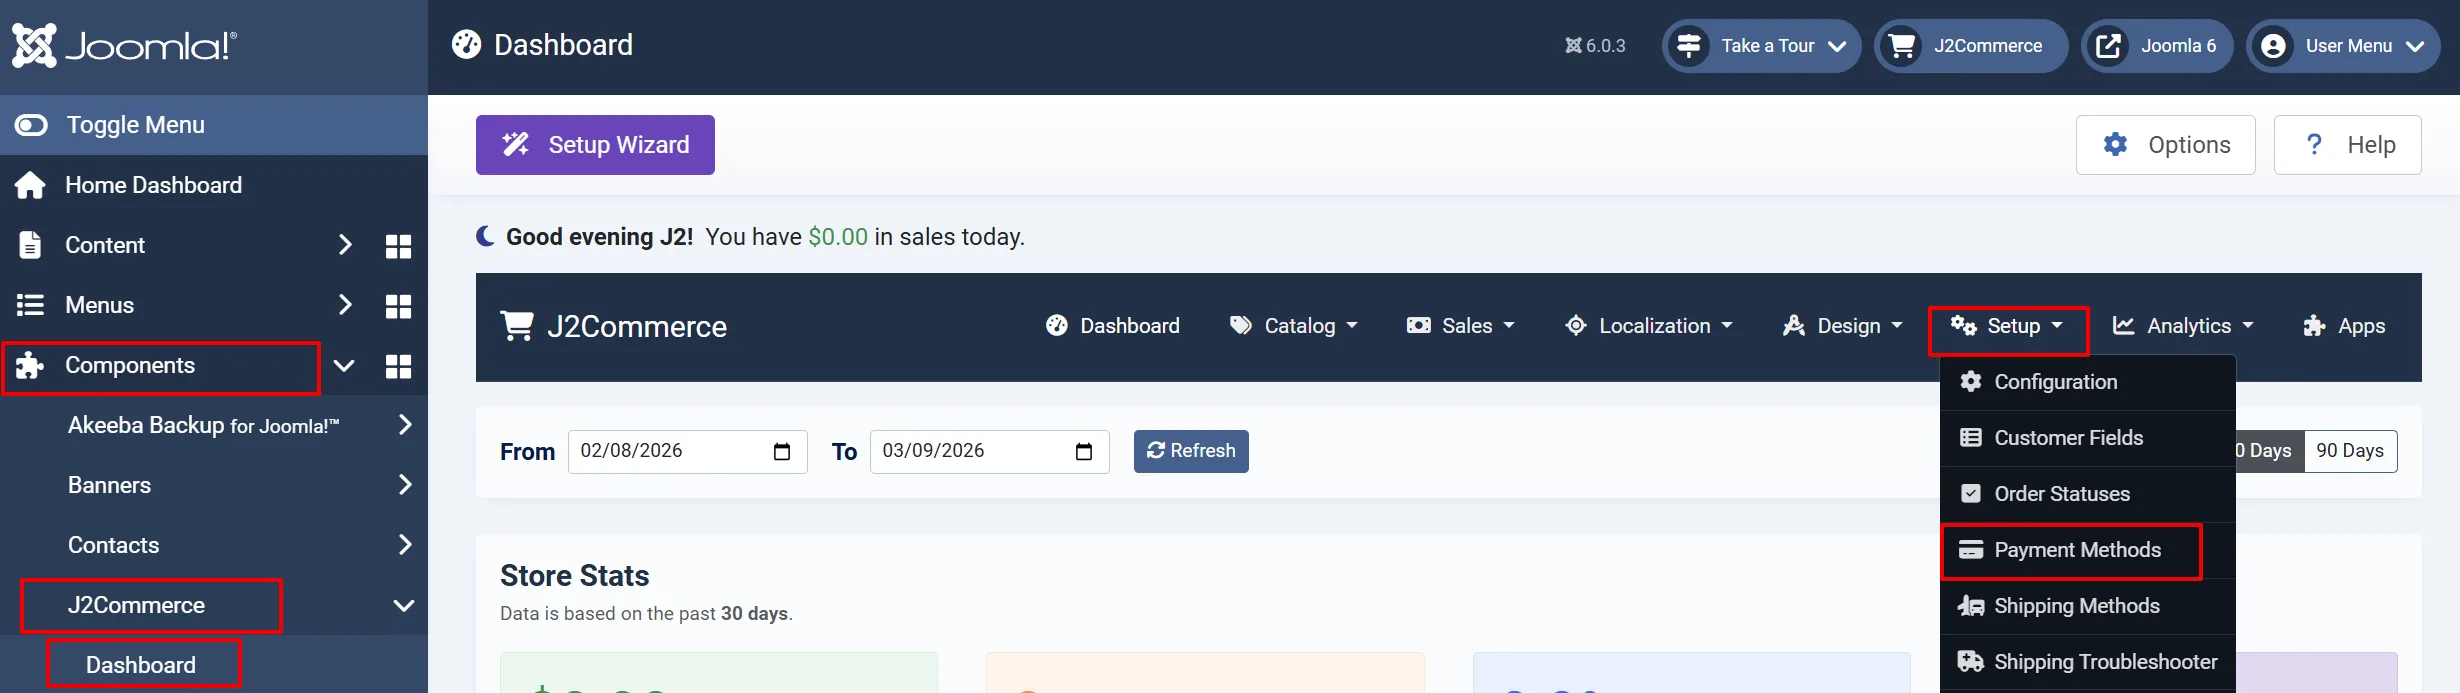
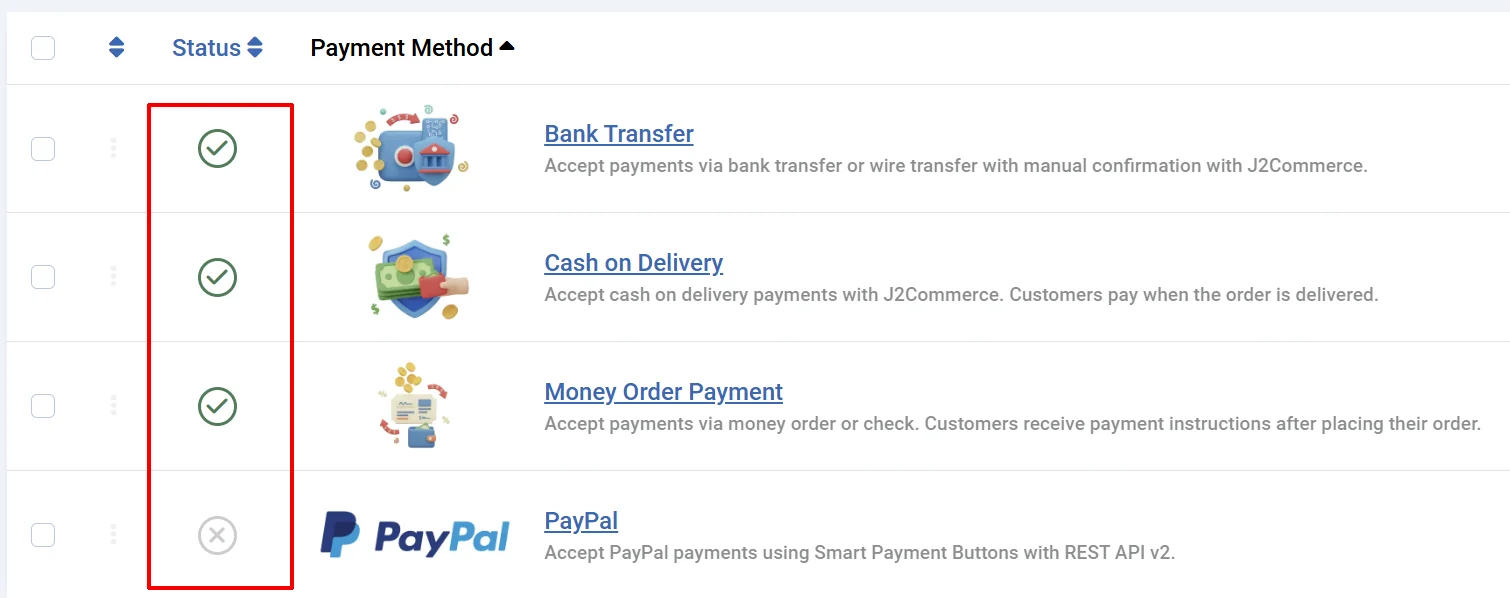
Make sure the payment methods you want to appear are enabled.
Monthly or Yearly Sales chart shows no data
Cause: No completed orders exist in the database, or all orders are in excluded statuses (Pending, Cancelled, etc.).
Solution: Place a test order then set its status to Confirmed or Processed in J2Commerce -> Orders. The chart will reflect it on the next page load.
A module published to a dashboard position does not appear
Cause: The module may be unpublished, have incorrect access settings, or the position name may not match exactly.
Solution:
-
Go to System -> Manage -> Administrator Modules.
Note: Another way to get there is in the sidebar, go to Content -> Administrator Modules, (depending on your Joomla version)
-
Find and open the module.
-
Confirm the Status is Published.
-
Confirm the Position exactly matches one of the five dashboard position names listed in the Module Positions section (the names are case-sensitive).
-
Save and reload the dashboard.
No messages are showing in the carousel area
Cause: The message carousel only appears when plugins have active notifications. If you see no carousel, it simply means no plugins are currently sending messages.
Solution: No action needed. Messages will appear automatically when a plugin has something to report (for example, when a payment gateway is in sandbox mode or a Download ID is missing).
Quick icons are missing from the dashboard
Cause: The mod_j2commerce_quickicons module may be unpublished, or individual icon types may be disabled in the module's parameters.
Solution:
-
Go to System -> Manage -> Administrator Modules. (or Content -> Administrator Modules)
-
Find and open J2Commerce Quick Icons.
-
Ensure the module is Published and assigned to a dashboard position (typically
j2commerce-dashboard-module-main-tab). -
Check that the show/hide Title toggles for each icon type are set to Show.
-
Save and reload the dashboard.