Reports
J2Commerce provides a suite of powerful reporting tools designed to give store owners a clear understanding of their sales performance, product popularity, and financial health.
Reports are designed to be flexible, allowing you to filter data by date, category, and other criteria, and visualize the results through interactive charts.
Available Reports
Currently, J2Commerce includes the following specialized reports:
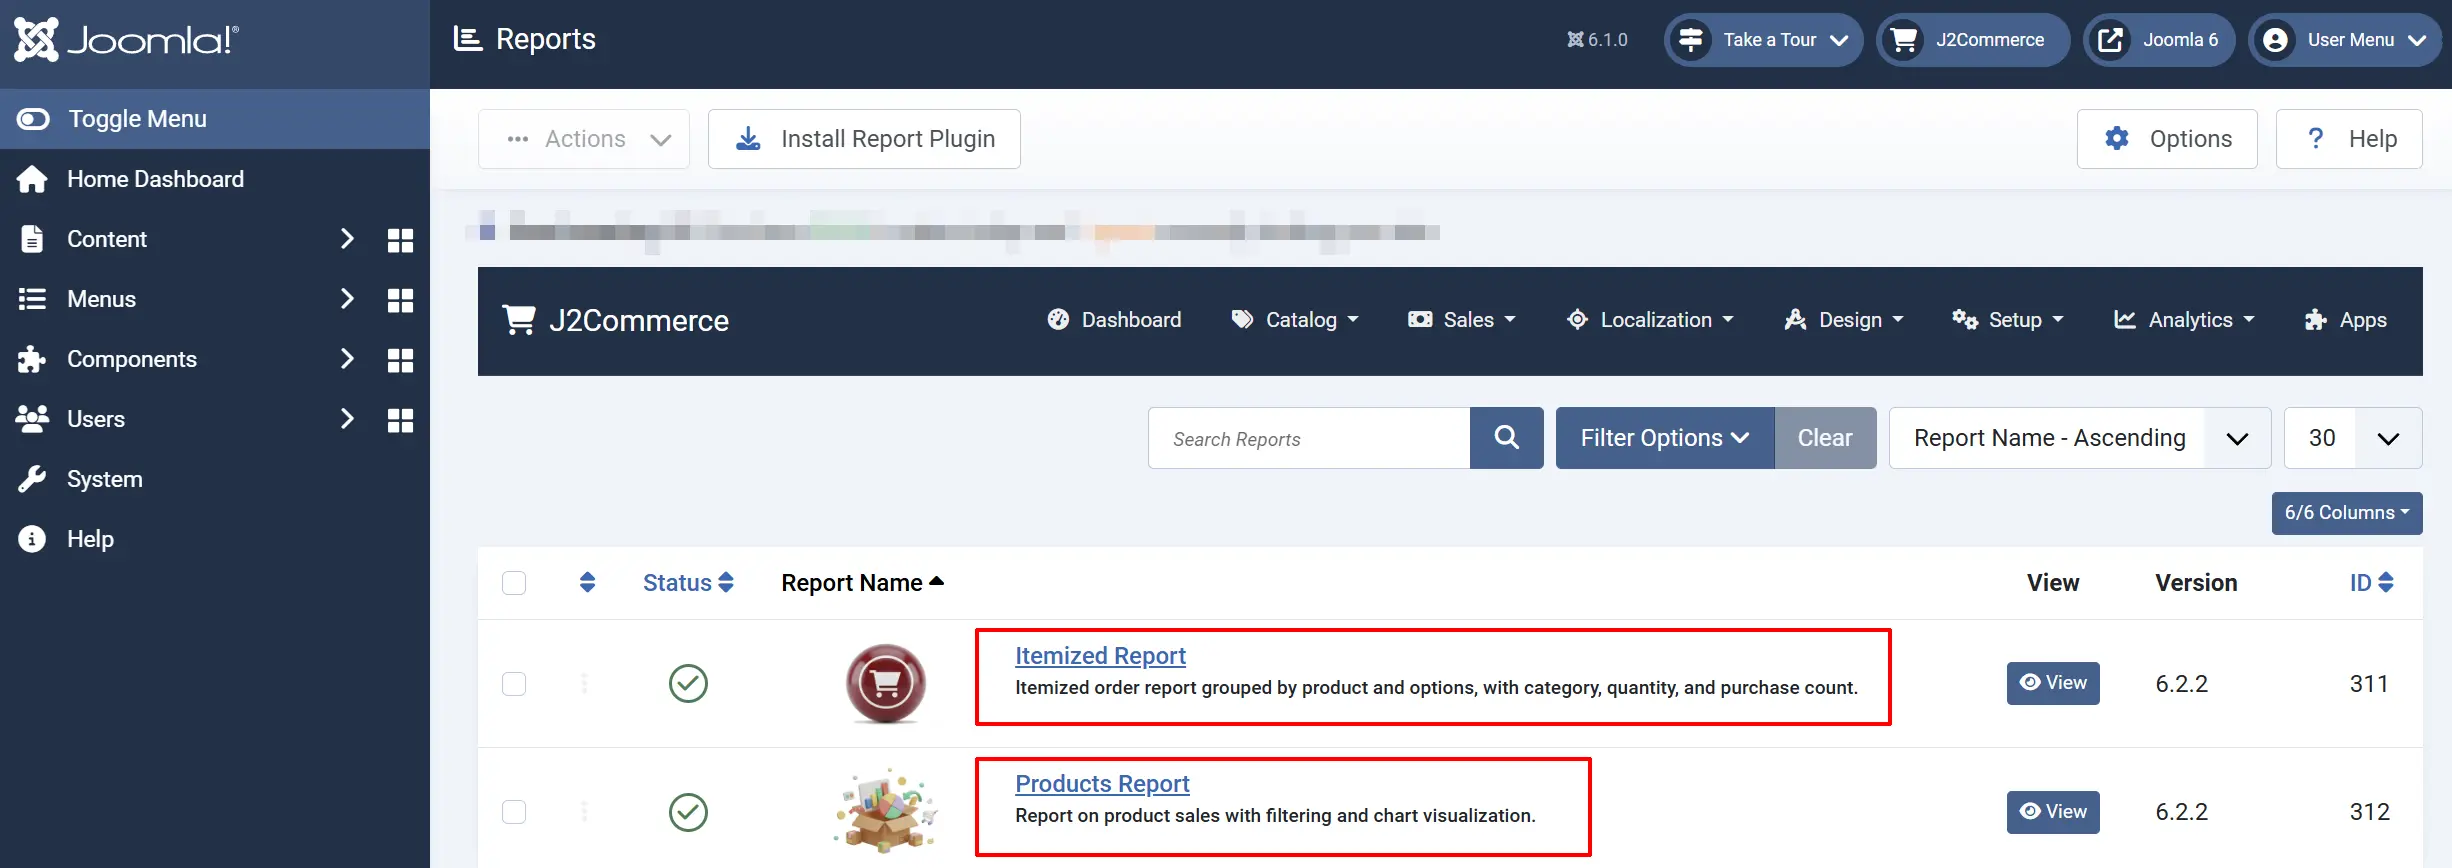
- Itemised Report: A granular breakdown of every product and variant sold. Best for analyzing which specific options (like size or color) are most popular.
- Products Report: A financial overview of sales per product. Best for tracking revenue, tax collection, and the impact of discounts.
Common Report Features
All J2Commerce reports share a consistent set of tools to help you analyze your data:
Visual Charts
Every report includes a bar chart that summarizes the key metric of that report (e.g., quantity for Itemised, revenue for Products). This provides an immediate visual understanding of your top performers.
Filtering
The report toolbar allows you to narrow down your data. You can filter by dates, categories, and other attributes to see how specific segments of your store are performing.
CSV Export
For advanced analysis, every report can be exported to a CSV file. This allows you to import your data into Excel, Google Sheets, or accounting software.
How to Use Reports
- Navigate to J2Commerce -> Analytics -> Reports.
- Select the report you wish to view.
- Use the Filter toolbar to refine your data.
- Analyze the Bar Chart for quick trends.
- Review the Data Table for precise numbers.
- Use the Export CSV button to save the data for external use.
Troubleshooting
No data is appearing in the report
If a report is empty, ensure that:
- You have completed orders in the system.
- Your filter criteria are not too restrictive (e.g., searching for a date range where no sales occurred).
- The order statuses are set to a state that is considered "saleable" for reporting.